
Figure 4.
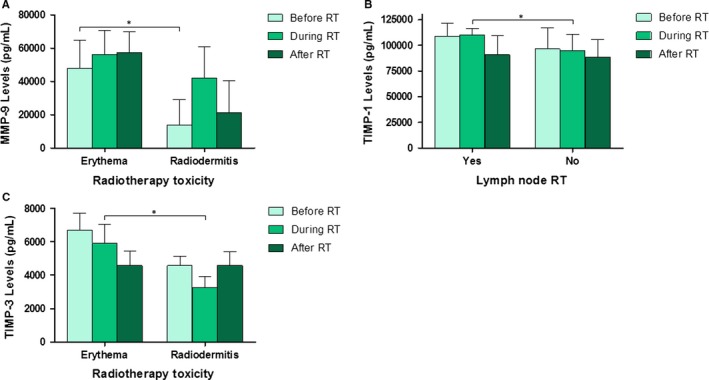
Serum levels of MMPs and TIMPs before, during and after RT based on RT‐related variables (A, B and C). Only the statistically significant variables are represented. (A) MMP‐9 levels in relation to radiation toxicity. (B) TIMP‐1 levels in relation to lymph node radiotherapy. (C) TIMP‐3 levels in relation to radiation toxicity. Values are presented as median ± SD (error bars); * P < .05