Figure 5.

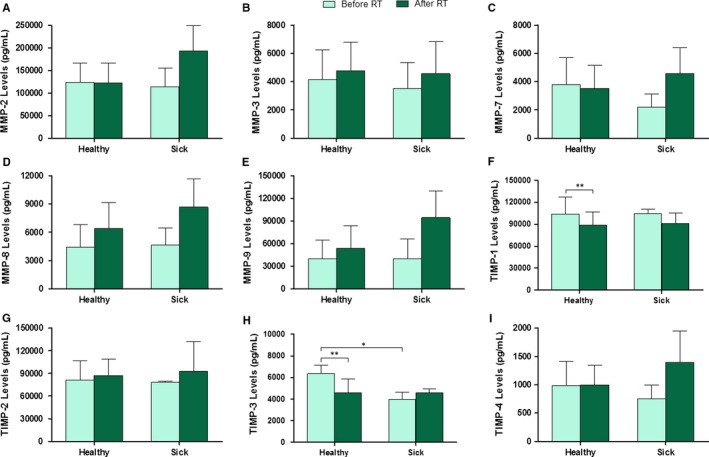
Serum levels of MMPs and TIMPs before and after RT in relation to the six‐month recurrence. Values are presented as median ± SD (error bars); * P < .05 and ** P < .01

Serum levels of MMPs and TIMPs before and after RT in relation to the six‐month recurrence. Values are presented as median ± SD (error bars); * P < .05 and ** P < .01