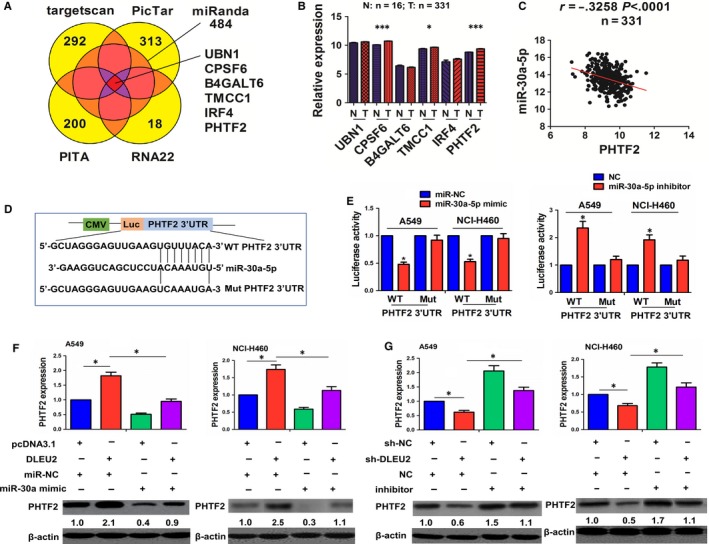
Figure 5.

miR‐30a‐5p reversed lncRNA DLEU2–induced PHTF2 expression in NSCLC cells. A, Identification of the targets of miR‐30a‐5p using a starBasev2.0 prediction tool. B, TCGA analysis of the expression levels of these target genes in unpaired LAC tissues. C, Pearson analysis of the correlation of miR‐30a‐5p with lncRNA PHTF2 expression in LAC tissues. D, Schematic representation of the binding sites between miR‐30a‐5p and WT or Mut PHTF2 3’UTR. E, Luciferase activity of WT or Mut PHTF2 3’UTR after the cotransfection with miR‐30a‐5p mimic or inhibitor and WT or Mut PHTF2 3’UTR in A549 and NCI‐H460 cells (F and G). qRT‐PCR and western blot analysis of the expression levels of PHTF2 after cotransfection with lncRNA DLEU2 plasmid and miR‐30a‐5p mimic or sh‐DLEU2 and miR‐30a‐5p inhibitor in A549 and NCI‐H460 cells. Data shown are the mean ± SEM of three experiments. *P < .05 and ***P < .0001
