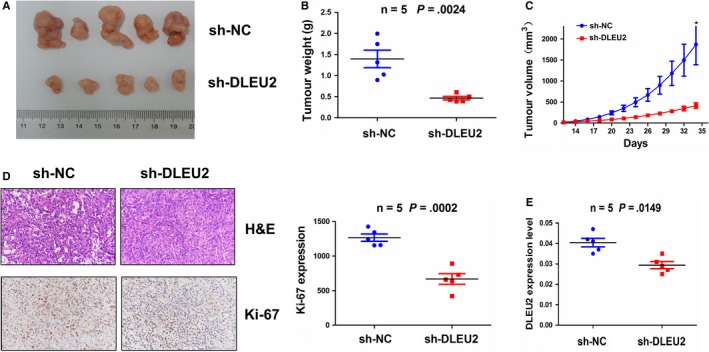
Figure 6.

Knockdown of lncRNA DLEU2 inhibited the xenograft tumour growth. A, Representative photographs of the xenograft tumours after the inoculation with sh‐DLEU2 and sh‐NC‐transfected A549 cells. B, Comparison of the average tumour weight between sh‐DLEU2 and sh‐NC groups. C, Growth curve analysis of the tumour proliferation activity after treatment with sh‐DLEU2 and sh‐NC groups. D, HE analysis of the morphological changes for the tumour cell growth between sh‐DLEU2 and sh‐NC groups, and IHC analysis of the expression levels of Ki‐67 in sh‐DLEU2 group. E, qRT‐PCR analysis of the expression levels of lncRNA DLEU2 in sh‐DLEU2 and sh‐NC groups. Data shown are the mean ± SEM of three experiments
