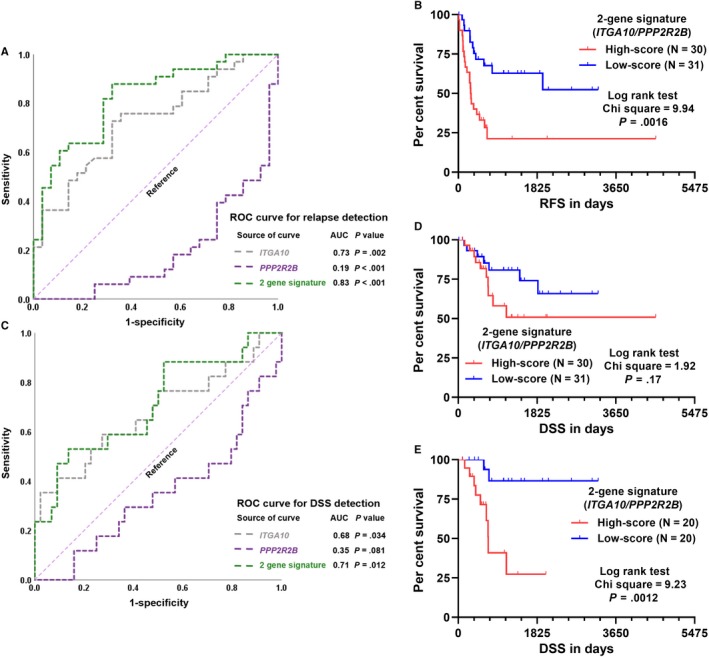
Figure 2.

ROC curve and K‐M curve analysis of the prognostic value of the 2‐gene signature. (A and C) ROC curves of the predictive value of the 2‐gene signature for relapse (A) and DSS (C) detection. (B, D and E) Kaplan‐Meier curves of RFS (B) and DSS (D and E) of 61 UPS/MFS patients. The comparisons were performed between two groups separated by the median risk score (B and D) or between the first and third tertile of the risk score (E)
