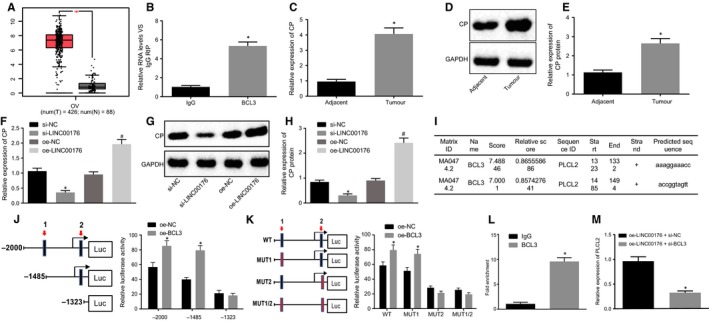
Figure 3.

LINC00176 promotes CP expression by recruiting BCL3. A, Expression of CP in ovarian cancer according to GEPIA database. B, Binding between LINC00176 and BCL3 detected by RIP assay; *P < .05 vs the IgG group. C, mRNA expression of CP in ovarian cancer and adjacent tissues determined by RT‐qPCR; *P < .05 vs the adjacent tissues. D and E, Western blot analysis CP protein in ovarian cancer and adjacent tissues normalized to GAPDH; *P < .05 vs the adjacent tissues. F, mRNA expression of CP in HO8910 cells after transfection determined by RT‐qPCR; *P < .05 vs the si‐NC group (HO8910 cells treated with si‐NC); #P < .05 vs the oe‐NC group (HO8910 cells treated with oe‐NC). G and H, Western blot analysis of CP protein in HO8910 cells normalized to GAPDH; *P < .05 vs the si‐NC group (HO8910 cells treated with si‐NC); #P < .05 vs the oe‐NC group (HO8910 cells treated with oe‐NC). I, Two possible binding sites between BCL3 and CP DNA predicted online. J and K, Binding between BCL3 and CP DNA verified by dual‐luciferase reporter gene assay; *P < .05 vs the si‐NC group (HO8910 cells treated with si‐NC) or oe‐NC group (HO8910 cells treated with oe‐NC). L, Binding between BCL3 and CP DNA on site 2 detected by ChIP assay; *P < .05 vs the IgG group. M, CP expression in HO8910 cells after transfection of oe‐LINC00176 + si‐NC and oe‐LINC00176 + si‐BCL3 determined by RT‐qPCR; * P < .05 vs the oe‐LINC00176 + si‐NC group (HO8910 cells treated with oe‐LINC00176 + si‐NC). All data were measurement data and expressed as mean ± standard deviation. Comparison between two groups was analysed by non‐paired t test. Each reaction was run in triplicate
