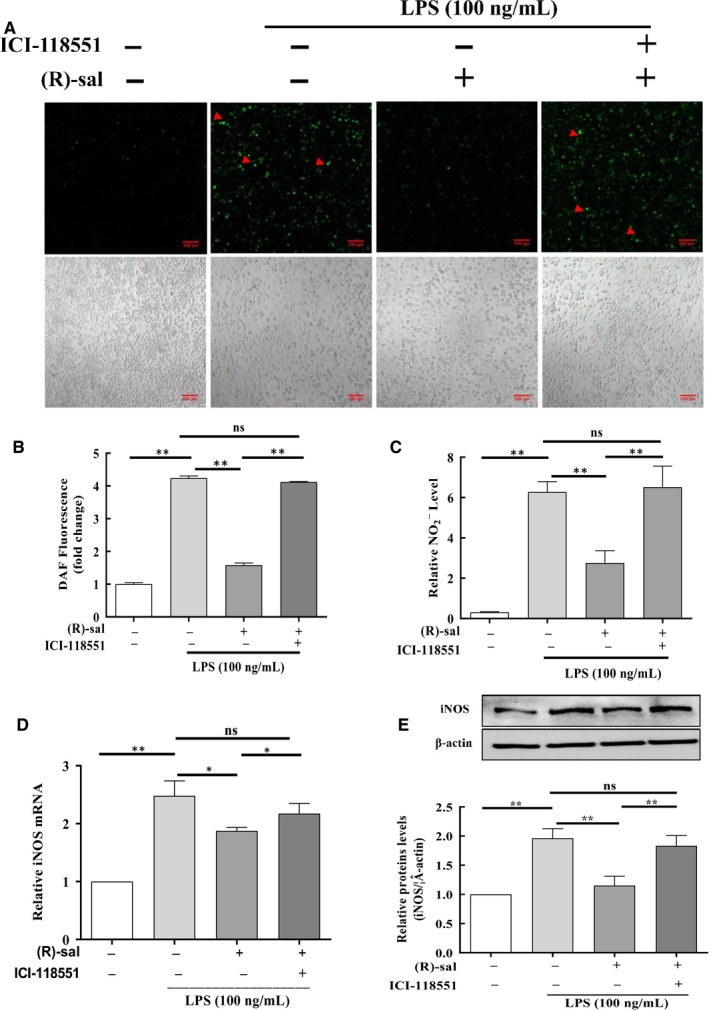
Figure 3.

Effects of (R)‐salbutamol on LPS‐induced NO production and the expression of iNOS in RAW264.7 macrophages. A, Representative images of control cells, LPS‐induced cells, LPS‐induced cells pretreated with (R)‐salbutamol and LPS‐induced cells pretreated with ICI‐118551 labelled with the fluorescent NO indicator DAF‐FM DA (indicated by red arrows) for 30 min. Images were captured by a confocal microscope. B, Fluorescence quantification of NO was performed on digitalized images using ZEN 2011 Image Solution software (scale bars, 100 μm). C, Graph showing the content of NO2 − in the cell supernatants of control cells, LPS‐induced cells, LPS‐induced cells pretreated with (R)‐salbutamol and LPS‐induced cells pretreated with ICI‐118551 using Griess reagent. D,E, iNOS protein and mRNA expressions in control cells, LPS‐induced cells, LPS‐induced cells pretreated with (R)‐salbutamol and LPS‐induced cells pretreated with ICI‐118551 as quantified using Western blotting and qPCR. Data are presented as the mean ± SD. ** P < .01, * P < .05; ns, not significant
