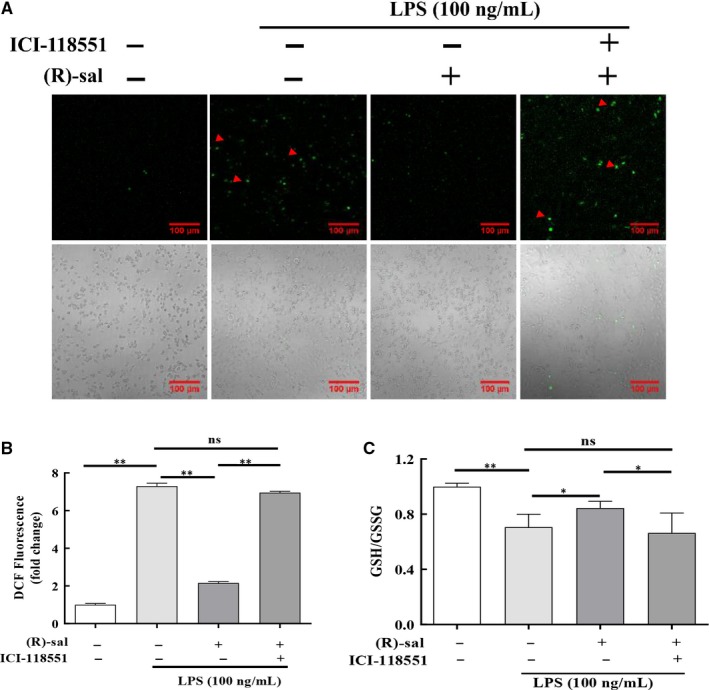
Figure 4.

Effects of (R)‐salbutamol on the LPS‐induced production of ROS and GSH/GSSG in RAW264.7 macrophages. A, ROS formation (indicated by red arrows) of control cells, LPS‐induced cells, LPS‐induced cells pretreated with (R)‐salbutamol and LPS‐induced cells pretreated with ICI‐118551 was monitored with the fluorescence probe DCFH‐DA. B, Fluorescence quantification of ROS was performed on digitalized images using ZEN 2011 Image Solution software (scale bars, 100 μm). C, The GSH/GSSG ratio. Data are presented as the mean ± SD. ** P < .01, * P < .05; ns, not significant
