Figure 6.

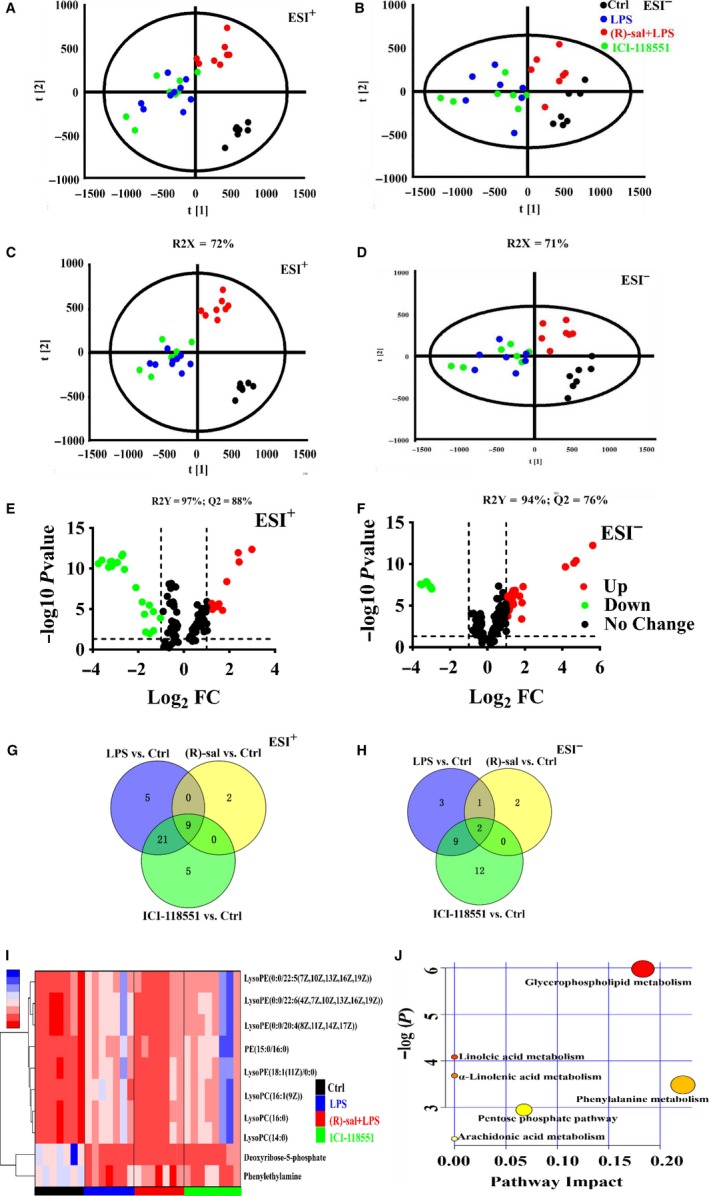
Effects of (R)‐salbutamol on the metabolomics of LPS‐induced RAW264.7 macrophages. A,B, PCA score plot of macrophages in the control, LPS‐induced, (R)‐salbutamol and ICI‐118551 cohorts in the (A) ESI (+) and (B) ESI (−) modes. C,D, PLS‐DA score plot of the control, LPS‐induced, (R)‐salbutamol and ICI‐118551 groups based on the macrophage metabolic profiles in the (C) ESI (+) and (D) ESI (−) modes. E,F, Volcano plots of p values and fold change in the (E) ESI (+) and (F) ESI (−) modes. G,H, Venn diagrams of increased (G) or decreased metabolites (H) found in the binary comparisons of LPS vs control, (R)‐salbutamol vs control and ICI‐118551 vs control corresponding to the numbers reported in Table S3. I, Unsupervised hierarchical clustering of heat map changes in potential biomarker content in the control, LPS, (R)‐salbutamol and ICI‐118551 groups in the ESI (+) and ESI (−) modes. Columns: samples; Rows: biomarkers. Metabolite content—blue: high metabolic content; red: low metabolic content (J) Pathway analysis of the differential metabolism in the control, LPS, (R)‐salbutamol and ICI‐118551 groups based on topology analysis (x‐axis) and enrichment analysis (y‐axis) scores. The size and colour of each circle represent the impact factor of each pathway as well as the P value. Red pathways were more affected. This analysis was done via MetaboAnalyst 4.0. All data are shown as the mean ± SD. ** P < .01, * P < .05; ns, not significant
