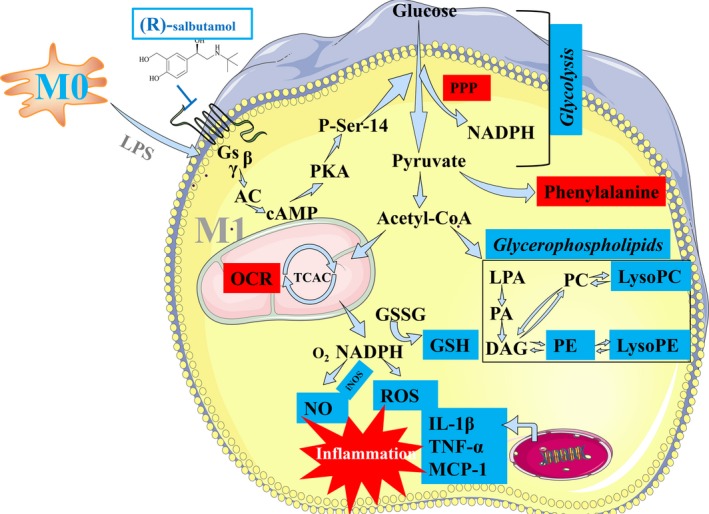
Figure 7.

Potential inhibitory effects of (R)‐salbutamol on M1 macrophage polarization and metabolism. Red and blue boxes represent the activation and inhibition of some indices that were evaluated in this study. Words in black are metabolites that were not detected in this experiment. Italic words in the blue boxes represent the pathways that were most affected in this study
