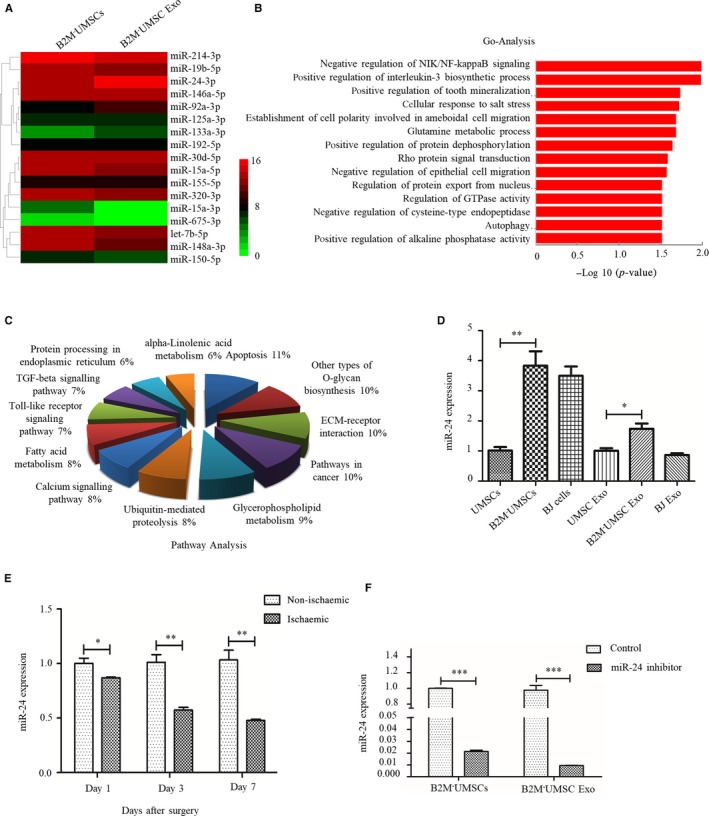
Figure 5.

Analysis of the expression of miR‐24 and associated pathway. A, Heatmap of miRNA sequencing data from B2M‐UMSCs and B2M‐UMSC exosomes (green, downregulated; red, upregulated). B, Gene ontology (GO) in B2M‐UMSC exosomes compared with B2M‐UMSCs. C, Analysis of pathways involving miRNAs. D, RT‐qPCR analysis of miR‐24 expression in cells and their derived exosomes. *P < .05, **P < .01. E, Real‐time PCR assessment of miR‐24 expression in ischaemic gastrocnemius at 1, 3 and 7 days. N = 3; *P < .05, **P < .01. F, Real‐time PCR analysis of miR‐24 expression in B2M‐UMSCs and B2M‐UMSC exosomes after transfection of the miR‐24 inhibitor compared to control. N = 3/group; ***P < .001
