
Figure 3.
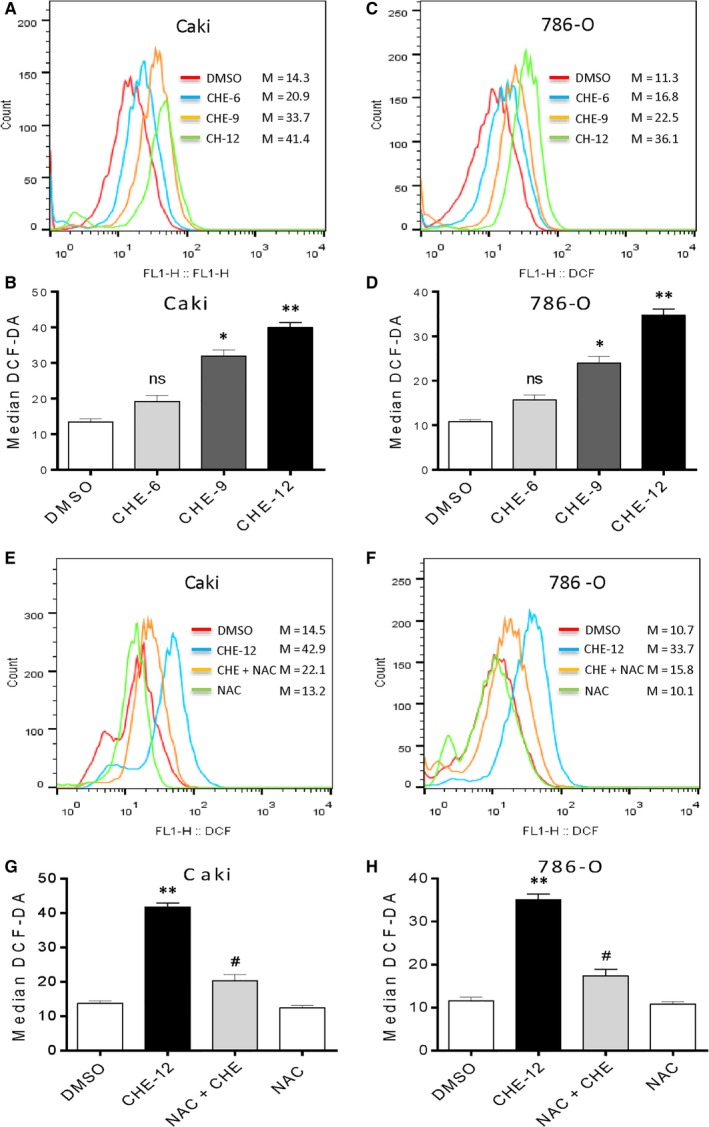
Chelerythrine (CHE) induces ROS accumulation in human renal cancer cells. (A, C) Intracellular ROS generation dose‐dependently induced by CHE was measured in Caki and 786‐O cells by staining with DCFH‐DA (10 μmol/L) and flow cytometry analysis. Caki and 786‐O cells were treated with CHE at the indicated concentrations for 3 h. Then, Intracellular ROS generation was measured by flow cytometry. (B, D) Quantification of data presented in panel A and C. (E, G) Effect of NAC pretreatment of 1 h on ROS levels. Relative fluorescence intensity was assayed by flow cytometer. (F, H) Quantification of data presented in panel E and G. All data here are expressed as means ± SD of triplicates. All images shown here are representative of three independent experiments with similar results. Data are shown as mean ± SEM (n = 3). *P < 0.05, **P < 0.01 compared with the dimethylsulfoxide group; # P < 0.05 compared with the CHE‐12 group