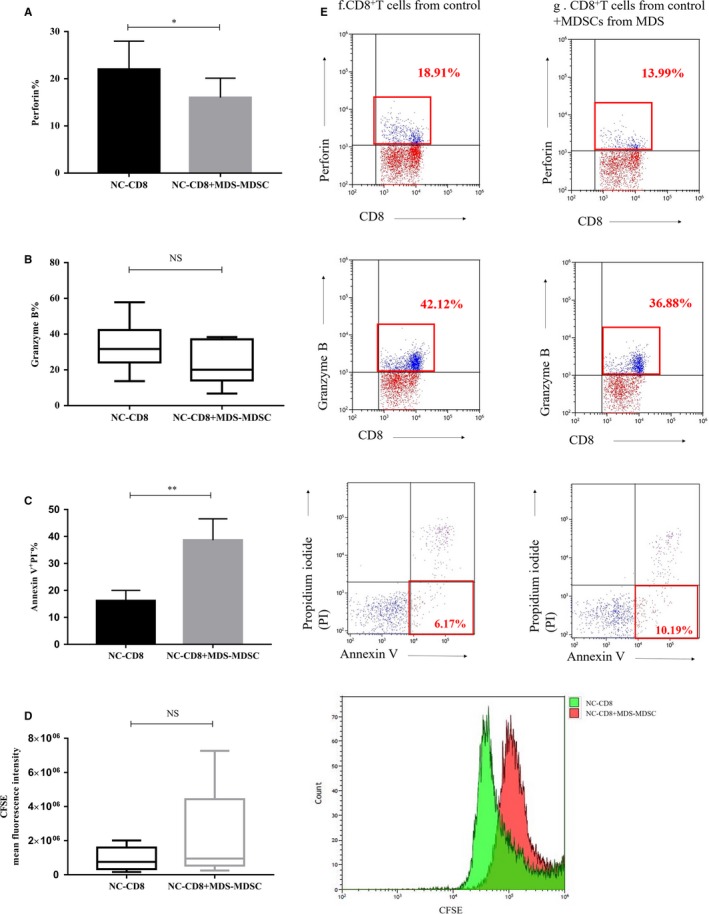
Figure 2.

(A‐D) The histogram represents perforin, granzyme B, early apoptosis and the MFI of CFSE in CD8+ T cells from normal controls (NC‐CD8) co‐cultured with MDSCs from MDS patients (MDS‐MDSC) or cultured alone. (E) The cells in the red rectangle represent the expression of perforin, granzyme B and early apoptosis of CD8+ T cells from NC that were cultures alone or co‐cultures with MDSCs from MDS patients. The red flow histogram represents proliferation of CFSE‐labelled NC‐CD8 co‐cultured with MDS‐MDSC, and the green histogram represents NC‐CD8 cultured alone. *P < .05, **P < .01, NS = not significant
