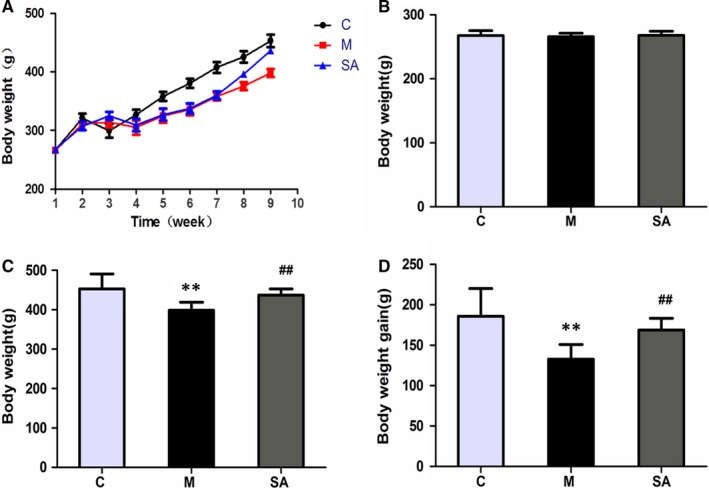
Figure 2.

Effects of SA on experimental animal bodyweight. A, Weight growth curve during the whole process of building the depression model. With time, the bodyweight of each group gradually increased. The weight growth rate of rats in the M group was significantly lower than that of the C group, and the rate of the SA group was between those of the M group and the C group. B, Bodyweight of each group before CUMS procedure (W1). There was no significant difference between the groups (P > .05). C, The final bodyweight (W9) of each group. D, The increase of bodyweight relative to the initial weight (W9 − W1). SA (50 mg/kg) reversed the weight changes induced by CUMS exposure. All of the values are presented as means ± SEM. **P < .01 as compared with the C group. ##P < .01 as compared to the M group. Data was analysed in a one‐way ANOVA followed by the LSD test
