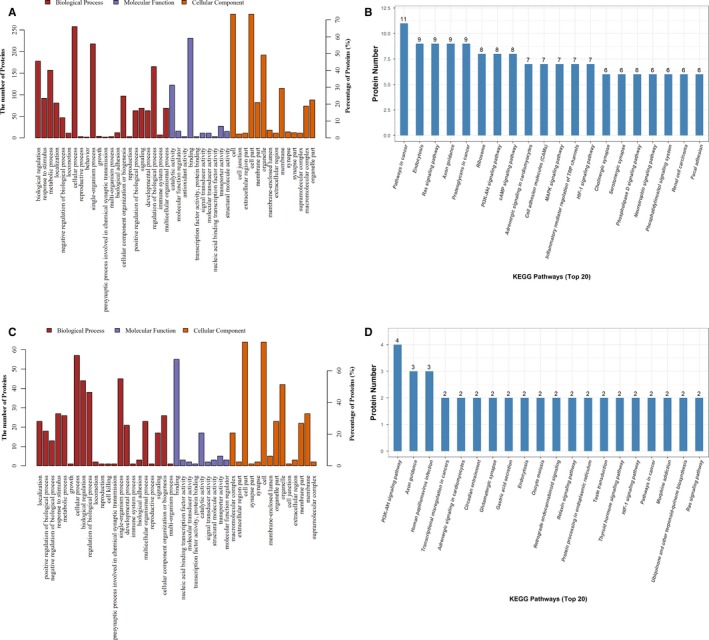
Figure 5.

A, The analysis result of the GO annotation of differentially expressed proteins between the C and M groups. Biological process, molecular function and cellular component are marked, respectively, with the colours red, blue and orange. B, The statistical results of the top 20 KEGG pathways associated with the differentially expressed proteins between the C and M groups. C, GO annotation of differentially expressed proteins between the M and SA groups. D, The top 20 KEGG pathways associated with the differentially expressed proteins between the M and SA groups
