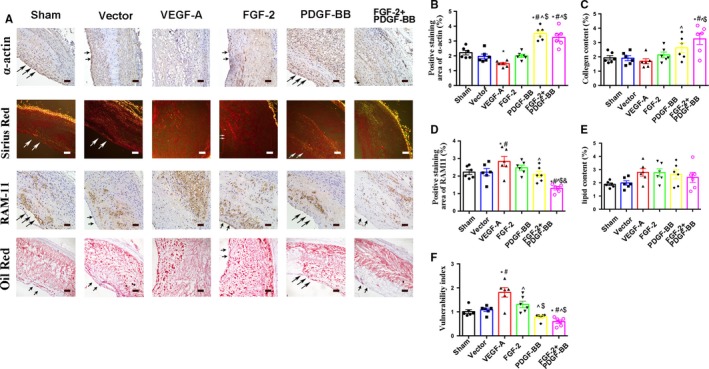
Figure 2.

The effects of growth factors on atherosclerotic plaque vulnerability. A, Immunostaining of sections with the anti‐α‐SMC actin and anti‐RAM‐11 antibodies, Oil Red O staining and Sirius Red staining. Bar, 20 μm. B‐F, Quantification of α‐SMC+ and RAM‐11+ (macrophages) cells and quantification of Oil Red O+ (lipidosis) and Sirius Red+ (collagen) staining (mean ± SEM; n = 6). Arrow indicated lumen surface. * P < .05 vs Sham; # P < .05 vs Vector; ^ P < .05 vs VEGF‐A; $ P < .05 vs FGF‐2; & P < .05 vs PDGF‐BB
