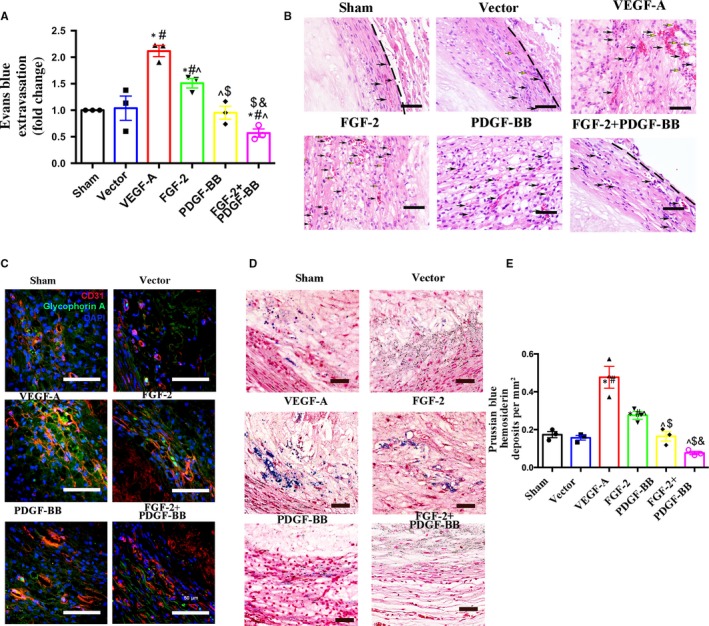
Figure 4.

Histologic analysis of intraplaque neovessels in each group. A, Quantification of Evans Blue dye leakage into plaques in the sham, vector, VEGF‐A, FGF‐2, PDGF‐BB and FGF‐2 + PDGF‐BB groups (mean ± SEM; n = 3). B, H&E staining demonstrating the presence of RBCs (black arrows indicate RBCs within the luminal wall of neovessels and yellow arrows indicate RBC leakage from neovessels) within atherosclerotic plaques. Bar, 20 μm. C, Plaque sections from rabbit abdominal aortas from each group were analysed on week 8 after transfection by IF double labelling for CD31 (an endothelial‐cell marker; red) and glycophorin A (an erythrocyte marker; green). Bar, 50 μm. D, Representative bright‐field microscopy analysis of Prussian Blue + hemosiderin (blue) counterstained with Nuclear Fast Red (pink) in each group. E, Graph demonstrating quantification of Prussian Blue + hemosiderin deposits from the sham, vector, VEGF‐A, FGF‐2, PDGF‐BB and FGF‐2 + PDGF‐BB groups (mean ± SEM; n = 3). * P < .05 vs Sham; # P < .05 vs Vector; ^ P < .05 vs VEGF‐A; $ P < .05 vs FGF‐2; & P < .05 vs PDGF‐BB
