Figure 7.

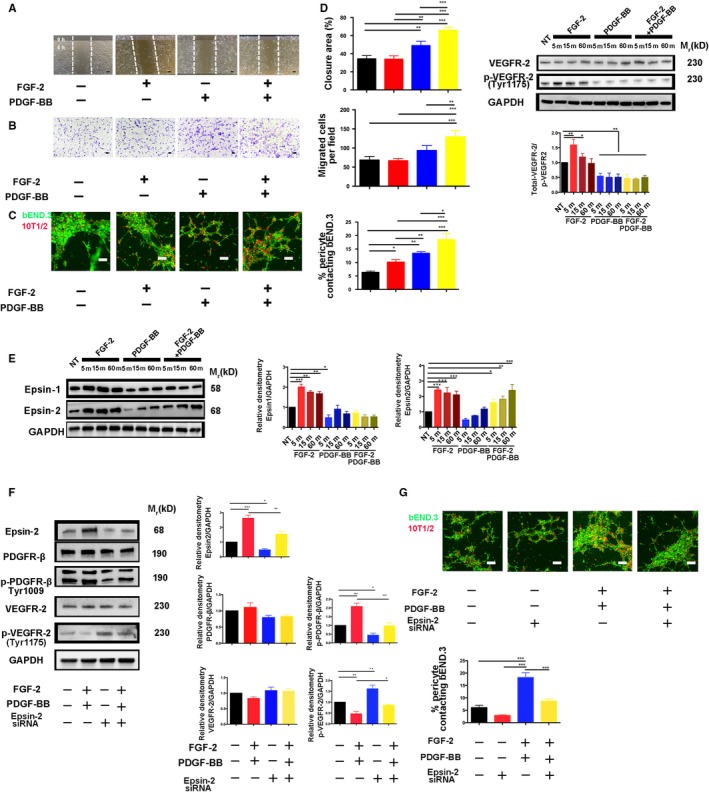
Effects of FGF‐2 + PDGF‐BB on pericyte migration, VEGFR2 degradation and epsin‐1/2 expression in vitro. A, Representative images and quantification of wound‐healing assay results at 0 and 6 h in FGF‐2‐, PDGF‐BB‐ or FGF‐2 + PDGF‐BB‐stimulated pericytes (n = 3 samples/group). Bar, 20 μm. B, Representative images and quantification of Transwell assays at 0 and 12 h in FGF‐2‐, PDGF‐BB‐ or FGF‐2 + PDGF‐BB‐stimulated pericytes (n = 3 samples/group). Bar, 20 μm. C, bEND.3 and 10T1/2 cells were labelled with carboxyfluorescein succinimidyl ester (green) and PKH26 (red), respectively and co‐cultured in Matrigel‐coated culture slides for 6 h under treatment with FGF‐2‐, PDGF‐BB‐ or FGF‐2 + PDGF‐BB. Bar, 20 μm. Quantification was performed by measuring the merged cells from 10 fields in three independent experiments. D, Time‐course analysis of total VEGFR‐2 and p‐VEGFR‐2 levels in FGF‐2‐, PDGF‐BB‐ or FGF‐2 + PDGF‐BB‐stimulated pericytes (n = 3 samples/group). E, Time‐course analysis of epsin‐1 and e‐2 protein levels in FGF‐2‐, PDGF‐BB‐ or FGF‐2 + PDGF‐BB‐stimulated pericytes (n = 3 samples/group). F, 10T1/2 cells transfected with either control siRNA or epsin‐2 siRNA were stimulated with FGF‐2 + PDGF‐BB and analysed by Western blot. Quantification of total PDGFR‐β, p‐PDGFR‐β, total VEGFR‐2 and p‐VEGFR2 levels (n = 3 samples/group). G, bEND.3 and 10T1/2 cells were labelled with carboxyfluorescein succinimidyl ester (green) and PKH26 (red), respectively, and co‐cultured in Matrigel‐coated culture slides for 6 h. Quantification was performed by measuring the merged cells from 10 fields in three independent experiments. Bar, 20 μm. All in vitro experiments were repeated at least twice. Data represent the mean ± SEM. All data as standardized values. *P < .05, **P < .01; and ***P < .001; analysis of variance. NT, no treatment
