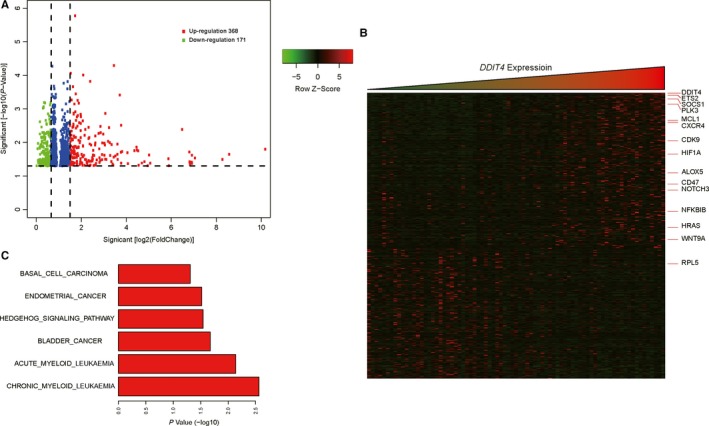
Figure 3.

Genome‐wide gene expression profile and cell signalling pathways associated with DDIT4 expression. (A) Volcano plot of differential gene expression. Up‐regulated and down‐regulated genes were labelled with red and green dots, respectively. (B) Heatmap of genes related to DDIT4 expression. (C) Gene ontology (GO) enrichment analysis of genes related to DDIT4 expression
