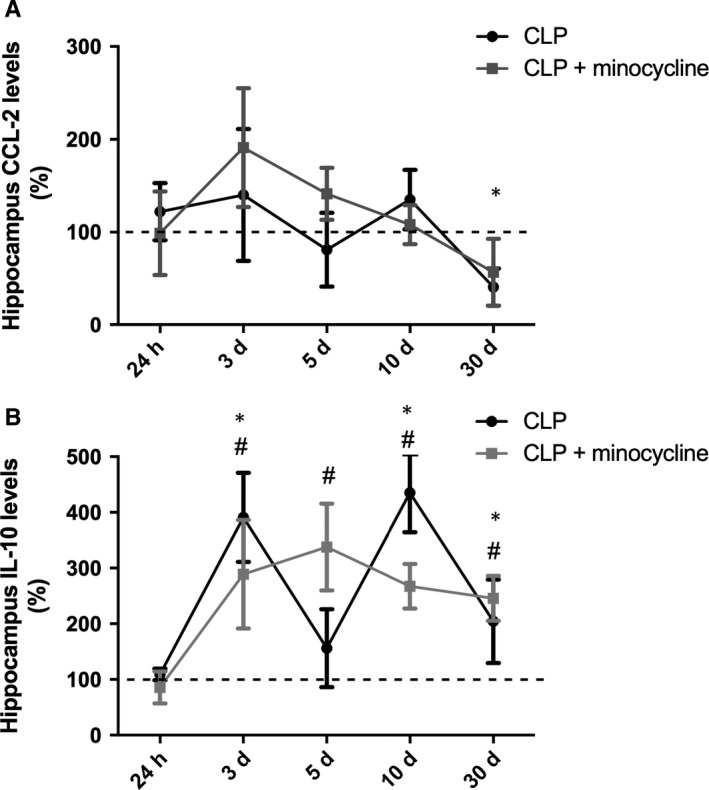
Figure 4.

Hippocampal pattern of M2 cytokines levels. M2 cytokines levels were measured 24 h, 3, 5, 10 and 30 d after sepsis induction in the hippocampus of animals treated with or without minocycline. (A) CCL‐22; (B) IL‐10. * different from that at 0 h (dotted line); # different from CLP + minocycline at the same time. Data are expressed as mean ± SD P < .05
