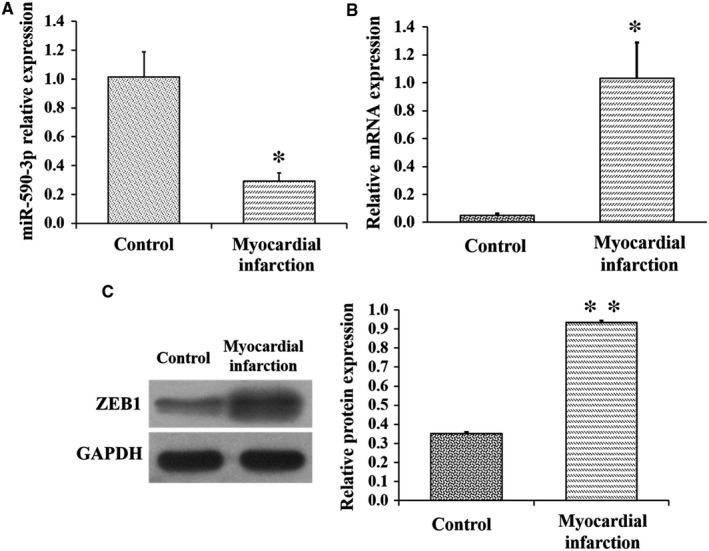
Figure 6.

Expression of miR‐590‐3p and ZEB1 in MI model of pigs. A, Expression of miR‐590‐3p at infarct area in control and MI pigs. The mRNA (B) and protein (C) expression levels of ZEB1 at infarct area in control and MI pigs. Data are shown as mean ± SD. *Indicates P < .05. **Indicates P < .01
