
Figure 2.
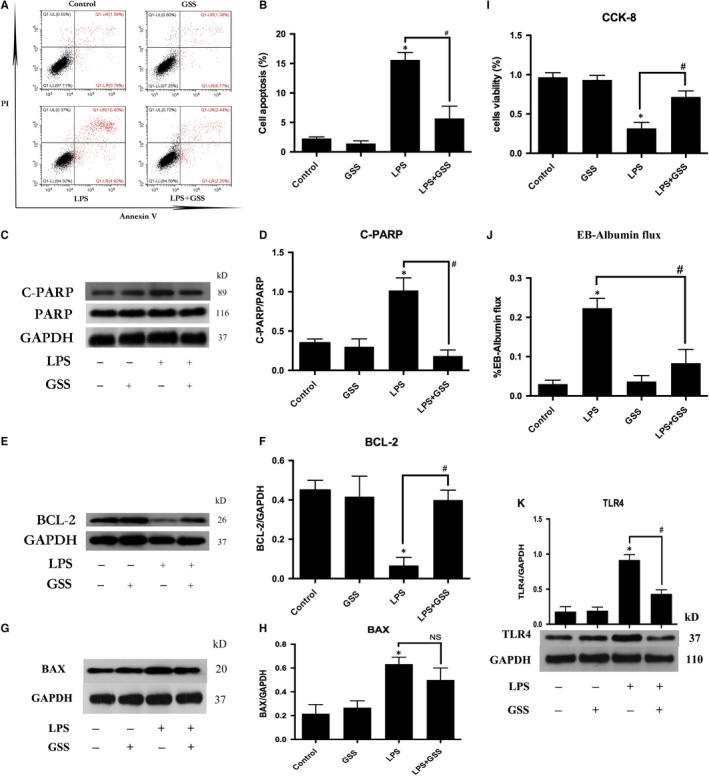
GSS inhibits LPS‐induced EC apoptosis via the TLR4/BCL‐2 signalling. A, ECs were pre‐treated with GSS for 2 h and then exposed to LPS for 24 h, and the apoptotic rate in ECs was detected by Annexin V/PI staining. B, The percentage of apoptotic cells rate is presented as a histogram showing the results obtained by flow cytometry. C, ECs were pre‐treated with GSS for 2 h and then stimulated with LPS for 24 h. The levels of cleaved PARP and total PARP protein were determined by Western blot analysis. D, The Western blot results are presented as a histogram showing the band intensity values. E, After pre‐treatment with GSS for 2 h, ECs were treated with LPS for 24 h, and BCL‐2 expression was detected by Western blot analysis. F, The Western blot results are presented as a histogram showing the band intensity values. G, After pre‐treatment with GSS for 2 h, ECs were treated with LPS for 24 h. The BAX expression was detected by Western blot analysis. H, The Western blot results are presented as a histogram showing the band intensity values. I, ECs were pre‐treated with GSS for 2 h and then exposed to LPS for 24 h. The cell viability rate of ECs was detected by CCK‐8. J, The ECs barrier leakage was checked by the flux of Evans blue‐labelled albumin (EB‐albumin) across ECs monolayers. K, After pre‐treatment with GSS for 2 h, ECs were treated with LPS for 24 h. The TLR4 expression was checked by Western blot analysis. *P < .05 vs negative control. # P < .05 vs the corresponding LPS treatment group