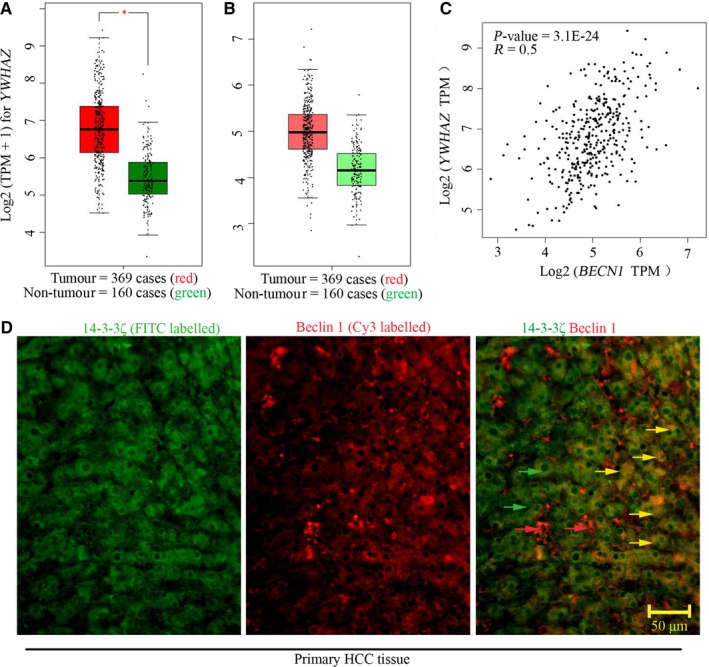
Figure 1.

Positive expression correlation of YWHAZ and BCEN1 gene in HCC. GEPIA public database was used to analyse the transcripts per million of (A) YWHAZ and (B) BCEN1 gene in samples derived from patients with HCC. (C) The expression correlation of these two genes was analysed with Spearman. (D) Immunofluorescence was performed to probe 14‐3‐3ζ and beclin 1 expression in primary HCC tissue. Green arrows indicated 14‐3‐3ζ, whereas red arrows indicated beclin 1. Yellow arrows indicated the colocalization of 14‐3‐3ζand beclin 1. Positive R value indicated positive correlation. A *P value <.05 was considered significant. BCEN1, beclin 1; GEPIA, Gene Expression Profiling Interactive Analysis
