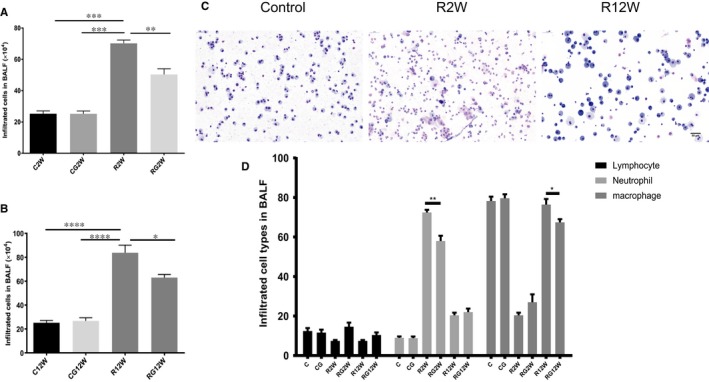
Figure 2.

Infiltrating cells in the BALF at 2 and 12 wk. A,B, Total numbers of infiltrating cells at 2 and 12 wk in the BALF. C, Representative Diff‐Quick staining images of cells in the BALF of no radiation and at 2 and 12 wk after irradiation. Scale bar = 50 µm. D, Statistical analysis results of three main cell types in the BALF after irradiation. (*P < .5, **P < .01, ***P < .001)
