Figure 3.

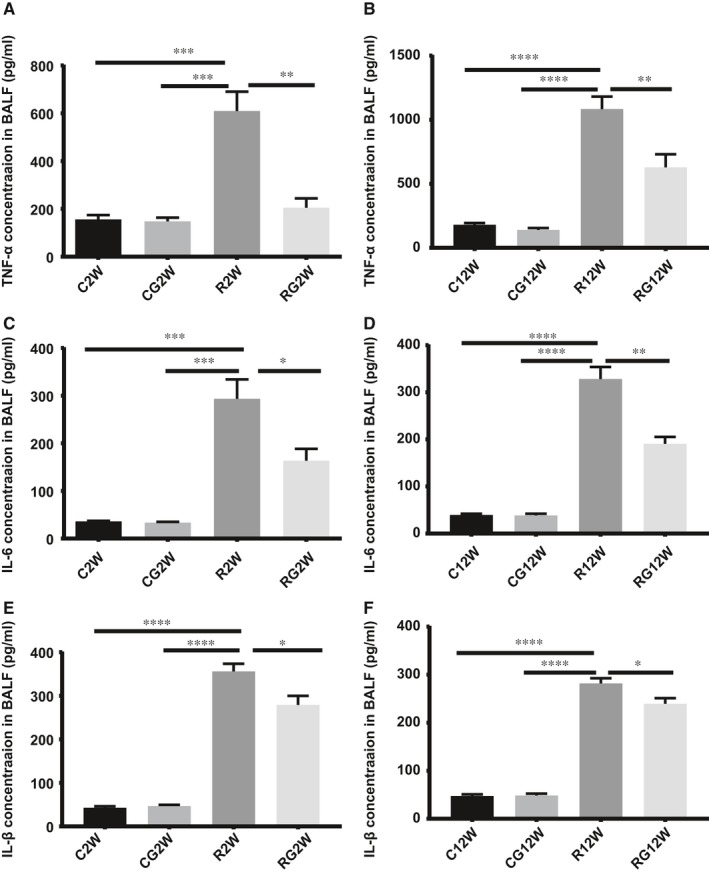
Cytokine concentrations in the BALF. TNF‐α, IL‐6 and IL‐1β concentrations in the BALF were measured by ELISA. A,C,E, 2 wk after irradiation; B, D, F, 12 wk after irradiation. (*P < .5, **P < .01, ***P < .001)

Cytokine concentrations in the BALF. TNF‐α, IL‐6 and IL‐1β concentrations in the BALF were measured by ELISA. A,C,E, 2 wk after irradiation; B, D, F, 12 wk after irradiation. (*P < .5, **P < .01, ***P < .001)