
Figure 2.
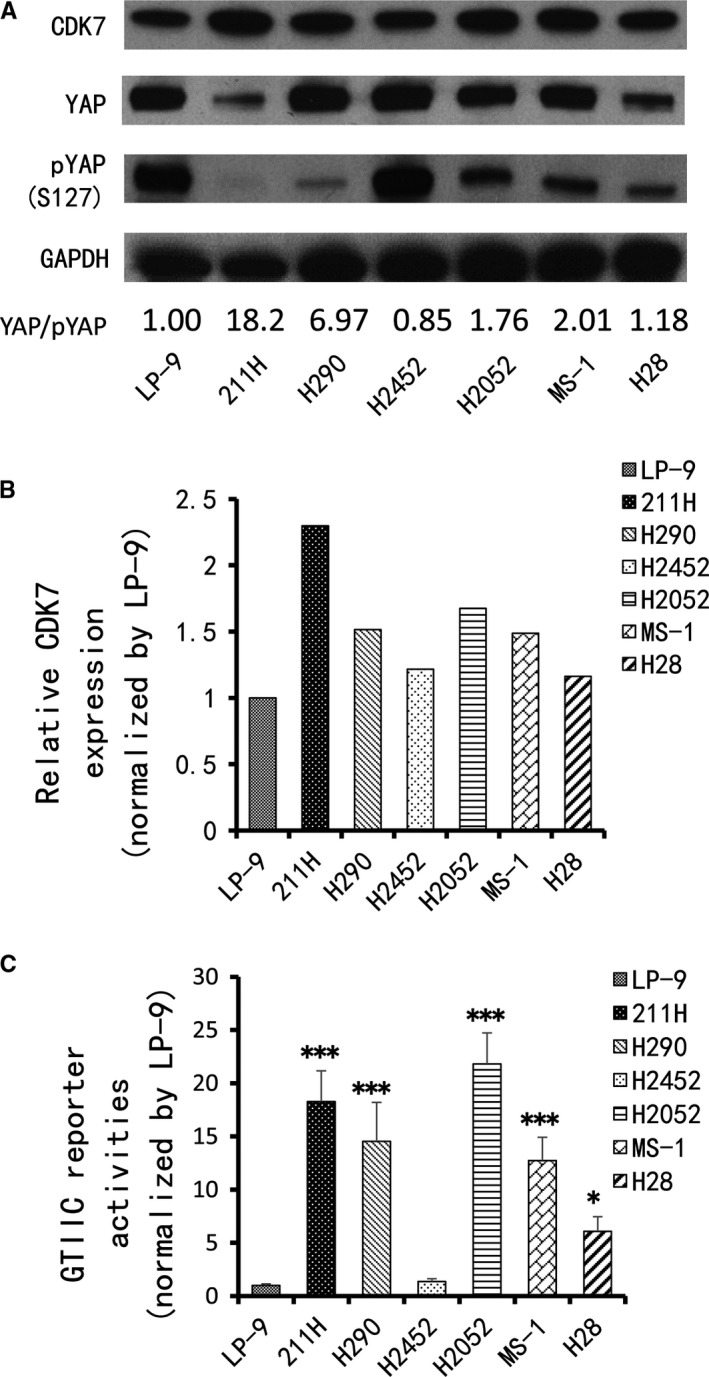
Expression of CDK7 and YAP in MPM cell lines. A, Western blot was used to detect levels of CDK7, YAP and pYAP in MPM cell lines. GAPDH was used as a loading control. Band intensity was analysed with ImageJ software and normalized to the intensity of the GAPDH band. The numbers below are YAP/pYAP ratio. B, CDK7 protein expression in MPM cell lines based on Western blot intensity. C, GTIIC reporter activity of the Hippo pathway in MPM cell lines; the LP‐9 cell line was used as a control (F = 38.017; P < .001) (vs LP‐9: *P < .05, **P ≤ .01, ***P ≤ .001, One‐way ANOVA, Scheffe multiple comparisons)