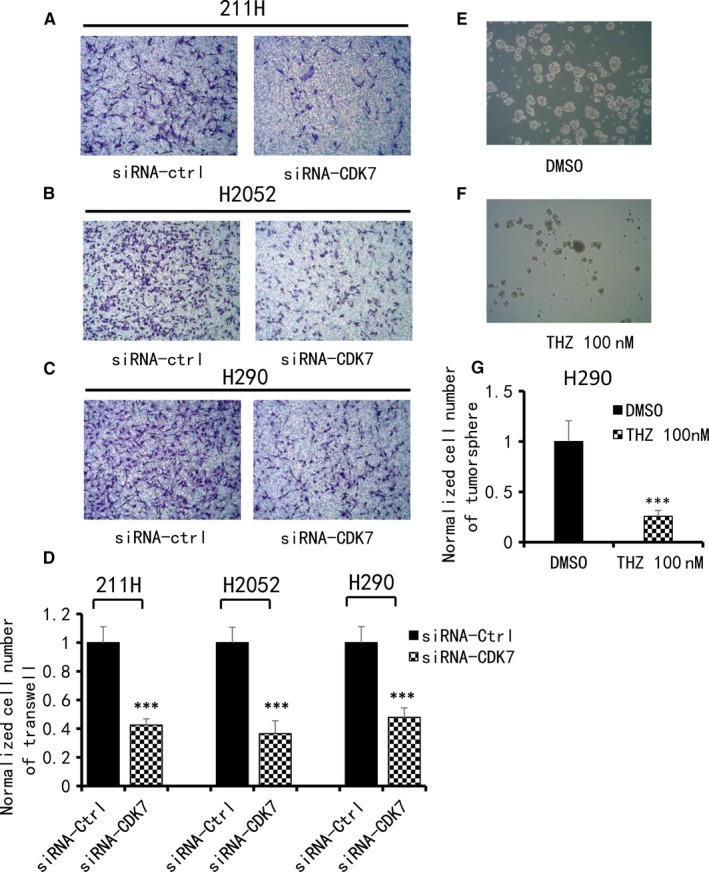
Figure 5.

Analysis of cell invasion and tumorsphere formation in MPM cells. A, B, C, Decrease in cell invasive ability after CDK7 siRNA treatment in 211H, H2052 and H290 cells. Images were taken under a 20× objective lens. D, Quantitative analysis of the number of cells that invaded the lower side of the membrane in each experimental group (**P < .01, ***P < .001, Student's t test). E, F, Decrease in sphere formation ability in H290 cells after THZ1 treatment compared with DMSO treatment. Images were taken under a 10× objective lens. G, Quantitative analysis of tumorsphere assay shows THZ1 treatment decreased tumorsphere formation ability in H290 cells (**P < .01, ***P < .001, Student's t test)
