
Figure 6.
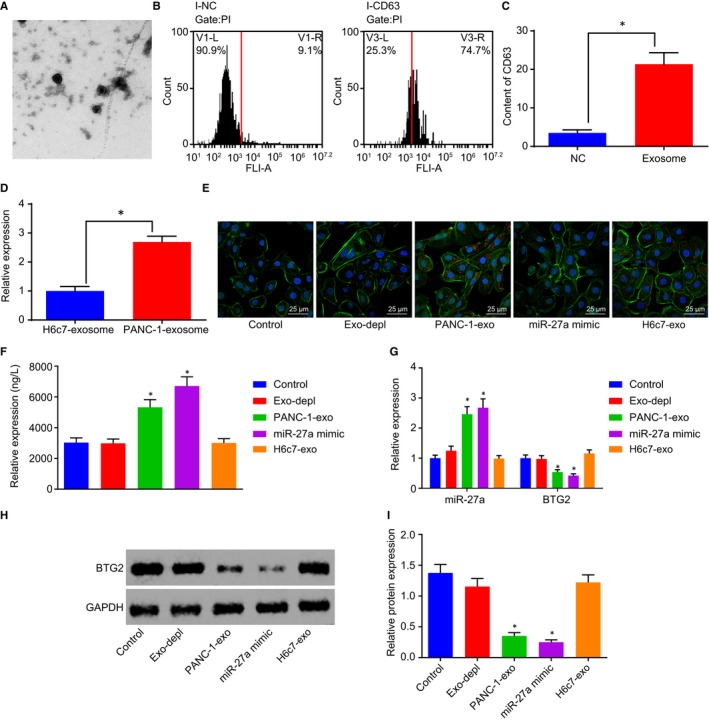
PANC‐1‐exo carries miR‐27a into HMVEC. A, The structure of exosomes identified by TEM (20 000×). B and C, The level of exosome surface marker CD63 in with or without exosomes measured by flow cytometry. D, The expression of miR‐27a in exosomes extracted from H6c7 and PANC‐1 cells. E, The uptake of exosomes by HMEC‐1 cells following the delivery of Exo‐depl, PANC‐1‐exo or miR‐27a mimic (400×). F, VEGF level in the co‐culture medium of PANC‐1‐exo and HMEC‐1 cells following the delivery of Exo‐depl, PANC‐1‐exo or miR‐27a mimic, as measured by ELISA. G, The expression of miR‐27a and BTG2 in HMEC‐1 cells following the delivery of Exo‐depl, PANC‐1‐exo or miR‐27a mimic. H and I, Protein level of BTG2 in HMEC‐1 cells following the delivery of Exo‐depl, PANC‐1‐exo or miR‐27a mimic. *P < .05 vs the treatment without exosomes or with exosomes secreted by H6c7. The above data are measurement data and described as mean ± standard deviation. Comparisons among multiple groups are analysed by one‐way analysis of variance. n = 12. The experiment was repeated 3 times independently. miR‐27a, microRNA‐27a; exo, exosomes; BTG2, B‐cell translocation gene 2; PC, pancreatic cancer; HMVEC, human microvascular endothelial cell; VEGF, vascular endothelial growth factor; TEM, transmission electron microscope; ELISA, enzyme‐linked immunoassay