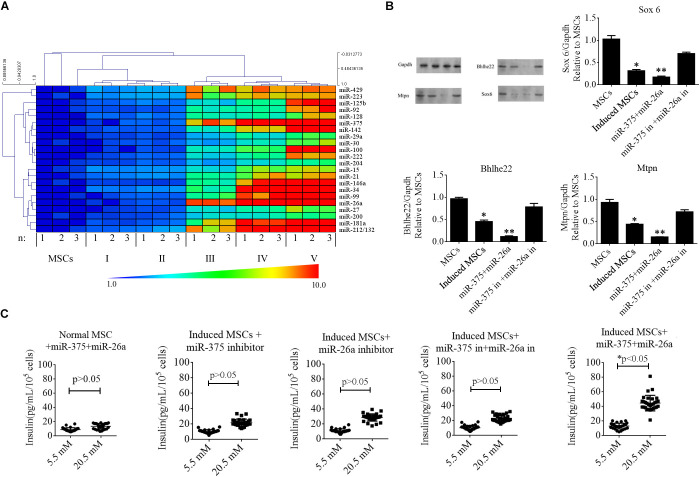
FIGURE 3.
Roles of specific miRNAs in beta cell differentiation from MSCs. (A) A heat map was used to represent the fold change in the expression of specific miRNAs during the five stages of differentiation of beta cells from MSCs based on RT-qPCR. MiR-375 and miR-26a were among those exhibiting the greatest increase in expression. (B) Western blotting analysis of targets of miR-375 and miR-26a in induced MSCs following the overexpression of miR-375 and miR-26a or that of their inhibitors (in). Over-expression of miR-375 and miR-26a inhibited the endogenous expression of Sox 6, Bhlhe22, and Mtpn, while the over-expression of miR-375 and miR-26a inhibitors enhanced the expression of these targets. Gapdh was used as an endogenous control. Values represent the mean ± SEM, n = 3. (C) Glucose-stimulated insulin secretion (GSIS) analysis of induced MSCs following the overexpression of miR-375 and miR-26a or that of their inhibitors (in). The data show that insulin secretion of all groups of induced MSCs decreased when the cells were treated with a higher glucose concentration except when miR-375 and miR-26a were over-expressed (n = 30; paired two-tailed t-test).

