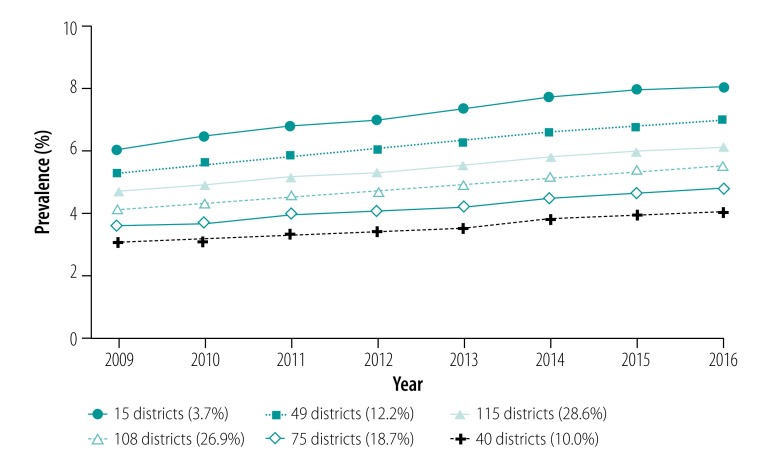
Fig. 2.
Temporal change in age-standardized asthma prevalence in 402 districts, clustered into six trajectories, Germany, 2009–2016
Notes: We created trajectories using the SAS procedure Proc Traj,22 the optimal number of six, which was based on the Bayesian Information Criterion. The German population from the year 2015 was used as a standard population;19 the standardization controls for possible demographic changes in the population structure in the study period.

