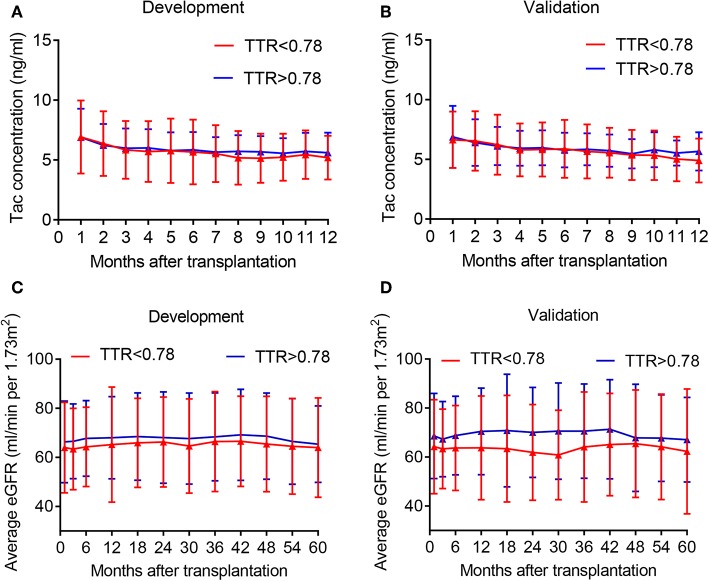
Figure 2.
Average tacrolimus concentration and eGFR distribution in the development and validation cohort at different time point. (A) Tac concentration in the development cohort; (B) Tac concentration in the validation cohort; (C) eGFR in the development cohort; (D) eGFR in the validation cohort. Tac, tacrolimus.

