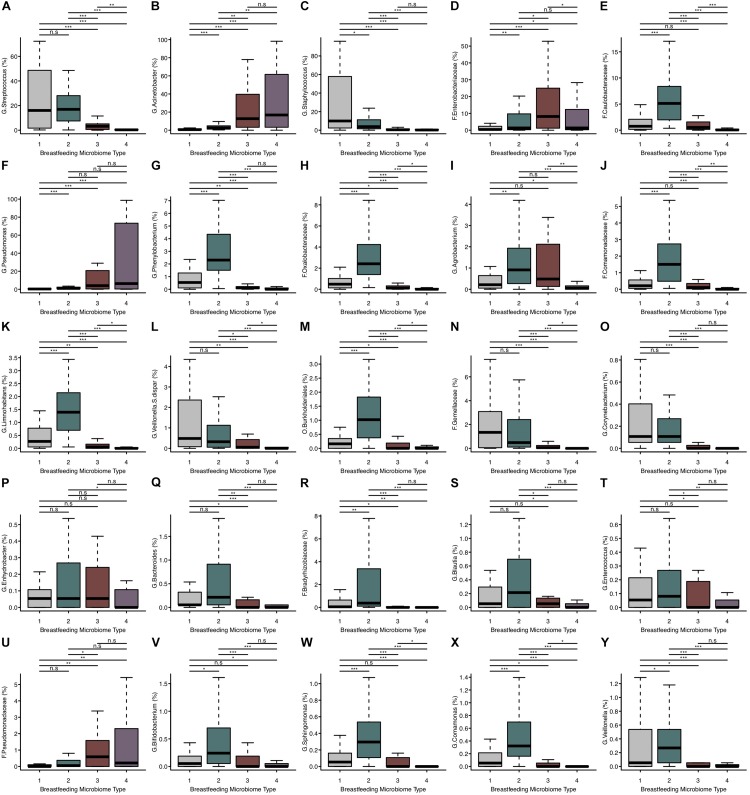
FIGURE 2.
The relative abundance of microbial taxa differs between BMTs. (A–Y) Boxplots showing the relative abundance of the top 25 most abundant microbial taxa in breast milk for each BMT. Significance was determined by the Kruskal-Wallis rank-sum test followed by Dunn’s test with FDR correction. Significance levels are n.s., not significant, ∗p-value < 0.05, ∗∗p-value < 0.01, ∗∗∗p-value < 0.001.

