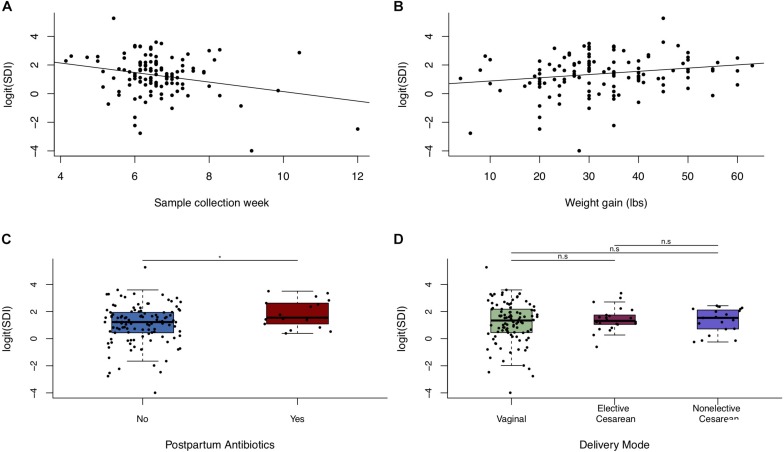
FIGURE 4.
Alpha diversity of breastfeeding microbiota in relation to maternal weight and delivery mode. Scatter plots (n = 123) of logit(SDI) vs. (A) postpartum week at sample collection week and (B) weight gain during pregnancy. (C) Boxplot of logit(SDI) vs. postpartum antibiotic exposure. (D) Boxplot of logit(SDI) vs. delivery mode (n = 123). Significance was determined by ANOVA followed by Tukey’s HSD. Significance levels are n.s., not significant, ∗p-value < 0.05.

