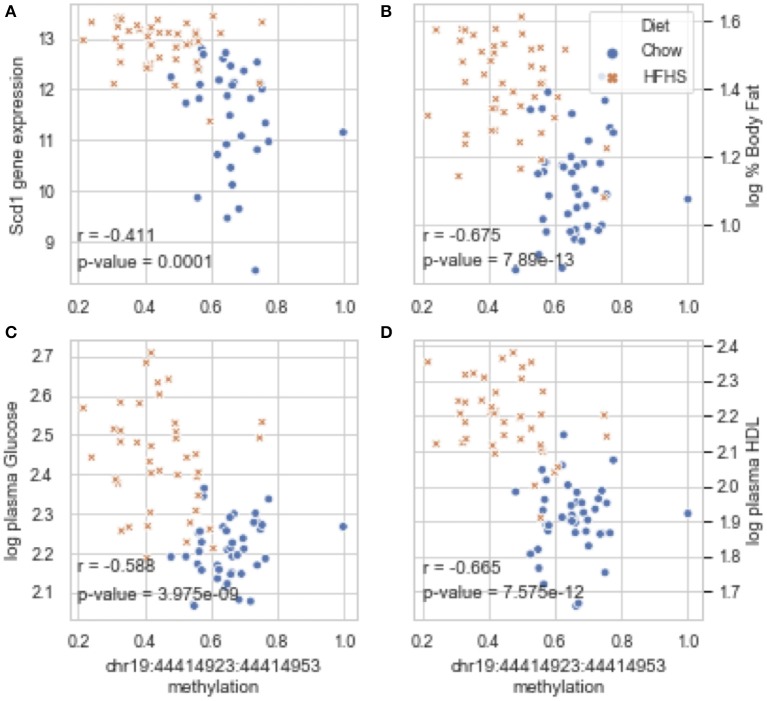
Figure 2.
Diet-induced changes in methylation correlate with cis-regulated gene expression and clinical traits. (A–D) Show correlation plots between the average methylation levels of 5 correlated CpGs on chr19 and microarray transcript levels, body fat measured by NMR, and plasma glucose and HDL in 37 strains from the obesity HMDP. The blue dots represent the average methylation and trait measurements of a strain fed chow diet, and the orange crosses show data from the same strains fed HFHS diet.

