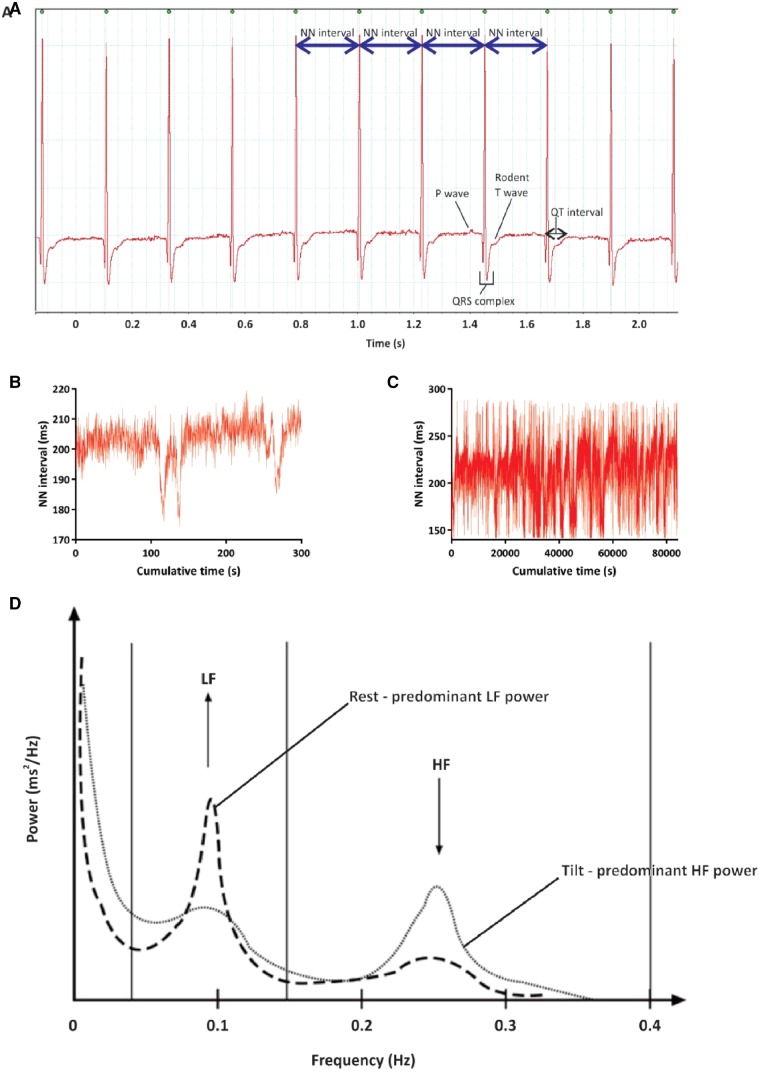
Figure 9.
HRV in recordings of spontaneous ECG data from in vivo rats. (A) HRV data are calculated from consecutive normal-to-normal (NN) intervals, usually being measured at the peak of the R-wave of the ECG. Although not obvious to the naked eye, when consecutive NN intervals are plotted on a graph of cumulative time (a so-called tachogram, shown in B and C) there is marked variation over both the short and long term. (B) Tachogram of spontaneous NN intervals over 5 min in a rat. (C) Tachogram of spontaneous NN intervals over 24 h in the same rat as shown in panel (B). (D) Reproduced and modified with permission from Gunther et al.224: typical power spectrum from frequency domain analysis of human short-term HRV. Note especially the peaks localized to the low and high frequency bands, and how they vary between rest and in this case tilt testing. The frequency bands are dependent on the mean HR of the organism being investigated and should be altered based on the mean HR of the organism being studied.

