Figure 1.
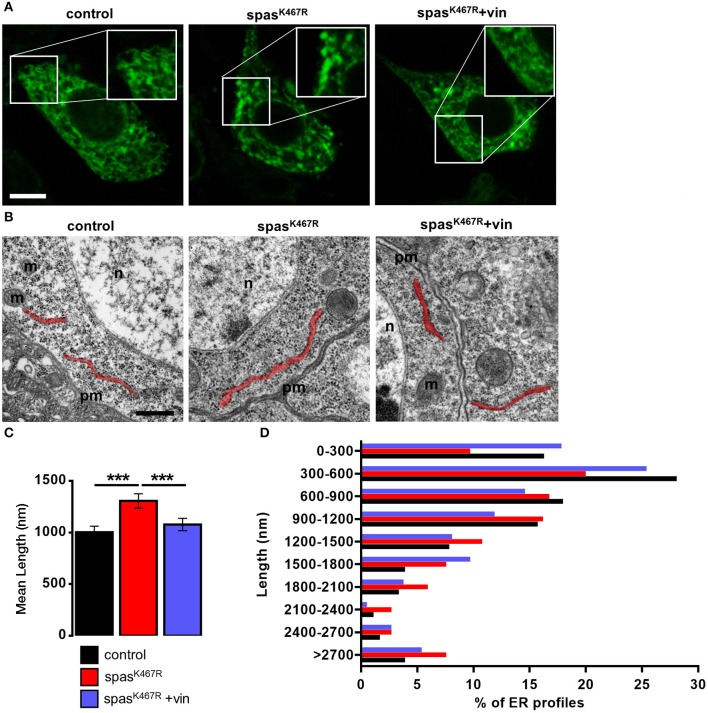
(A) Ventral ganglion motor neurons cell bodies of larvae of the indicated genotypes co-expressing BiP-sf-GFP-ER were imaged at the confocal microscope. Where indicated, spastinK467R flies were raised in vinblastine-containing food (50 nM). Scale bar, 5 μm. (B) TEM images of ventral ganglion neuronal cell bodies of larvae expressing spastinK467R and relative control; ER profiles are highlighted in red. pm, plasma membrane; n, nucleus; m, mitochondria. Scale bar, 500 nm. (C) Quantification of the mean length of ER profiles in TEM images for the indicated genotypes. Mean ± SEM, n ≥ 50 profiles. ***p < 0.001. (D) Distribution of ER profile length in TEM images. The percentage of measured profiles for each 300 nm-class is reported for the indicated genotypes.

