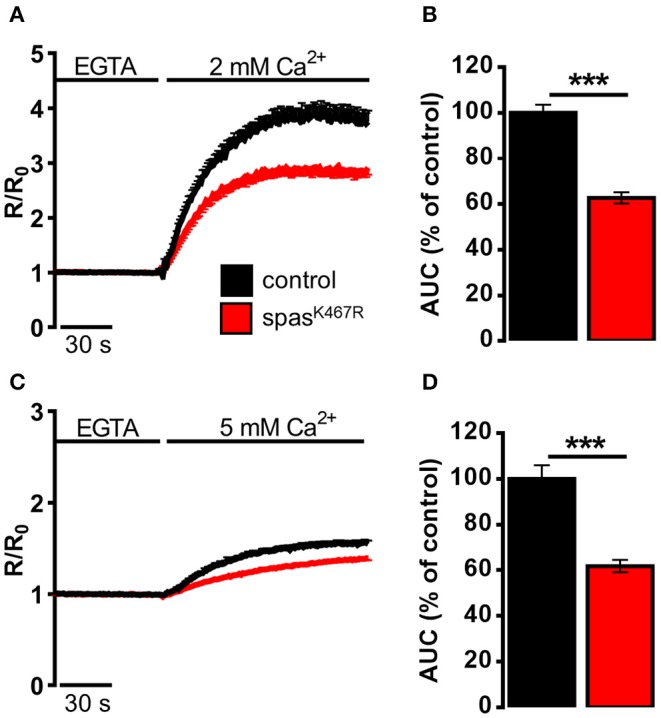
Figure 2.

Ca2+ dynamics induced by (A,B) SOCE activation, (C,D) SOCE activation in K+-based medium (see Materials and Methods) in neurons dissociated from larval brains expressing spastinK467R, and relative controls, as detected by fura-2. (A,C) Cells were pre-treated with thapsigargin in a Ca2+-free medium for 8 min, to empty intracellular stores, and then (A) 2 mM or (C) 5 mM CaCl2 was added. In all panels, average traces are represented as R/R0 values of n > 100 cells. (B,D) Histograms report the average area under curve (AUC) values of the traces recorded. Data are presented as mean ± SEM of n >100 cells. ***p < 0.001.
