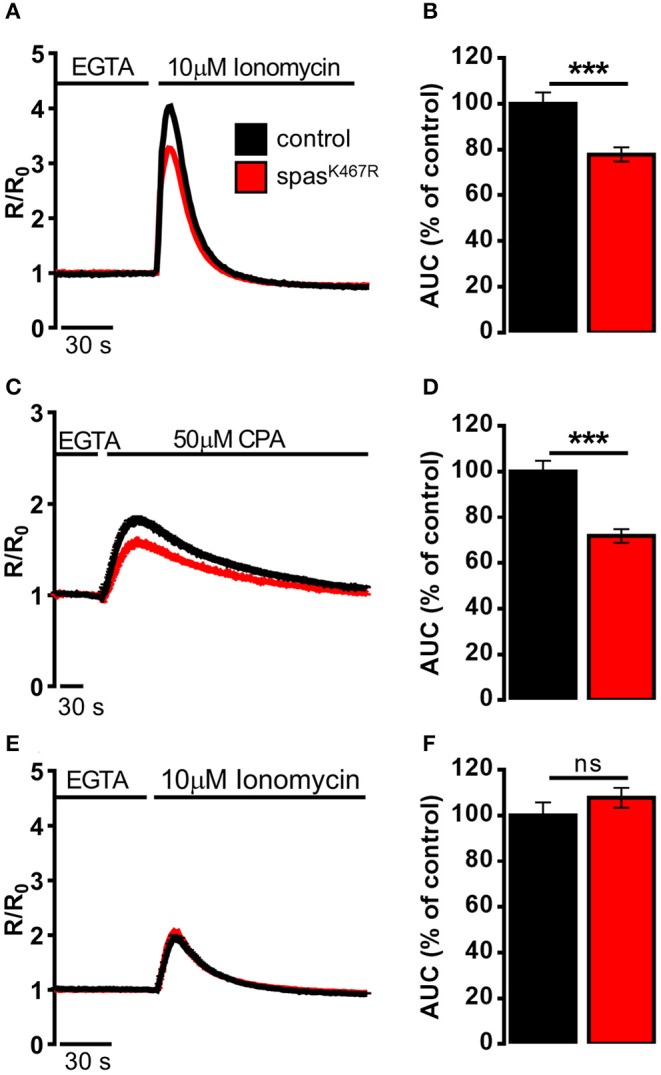
Figure 3.

Ca2+ dynamics induced by (A,B) ionomycin, (C,D) CPA, (E,F) ionomycin after CPA-induced ER depletion in neurons dissociated from larval brains expressing spastinK467R, and relative controls, detected by fura-2. (A,C,E) Cells were stimulated with (A,E) 10 μM ionomycin or (C) 50 μM CPA in the presence of extracellular Ca2+ chelator EGTA. In all panels, average traces are represented as R/R0 values of n > 100 cells. (B,D,F) Histograms report the average area under curve (AUC) values of the traces recorded. Data are presented as mean ± SEM of n > 100 cells. ***p < 0.001.
