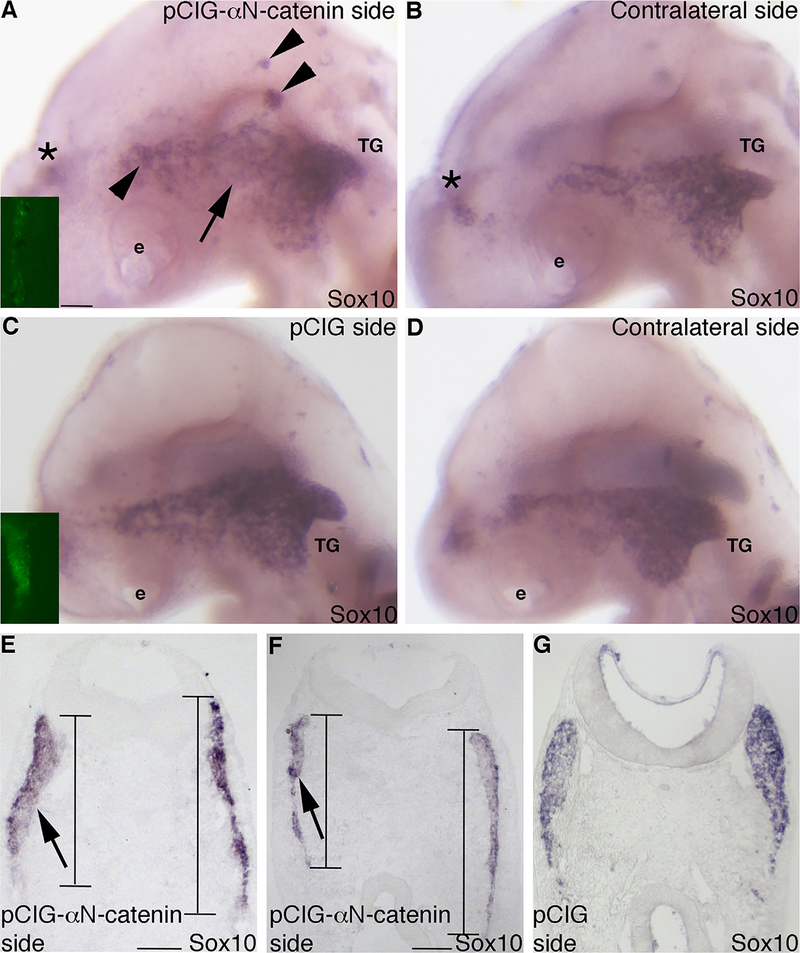
Fig. 5.
Overexpression of αN-catenin reduces the dorsal–ventral domain of migratory neural crest cells forming the trigeminal ganglion in vivo. (A,B) Representative image of a lateral view of an embryo head following whole-mount in situ hybridization for Sox10 after electroporation with the pCIG-αN-catenin expression construct and re-incubation to HH16. (A) Expression construct-treated and (B) contralateral side. Inset image in (A) shows GFP fluorescence of the electroporated expression construct on the left side of the neural tube that is not visible after in situ hybridization at this later stage. Arrow in (A) indicates a reduction in neural crest cells where they are normally apparent on the contralateral side (B) of the same embryo. Arrowheads in (A) point to Sox10-positive migratory neural crest cell aggregates. Asterisk (*) in (A,B) labels neural crest cells on the contralateral side of the embryo that are apparent due to the transparent nature of the embryo. (C,D) Representative image of a lateral view of an embryo head following whole-mount in situ hybridization for Sox10 after electroporation with the pCIG expression construct and re-incubation to HH15. (C) Expression construct-treated and (D) contralateral side. Inset image in (C) shows GFP fluorescence of the electroporated construct on the left side of the neural tube that is not visible after in situ hybridization at this later stage. (E–G) Representative transverse sections taken at the axial level of the developing trigeminal ganglia after pCIG-αN-catenin (E,F) or pCIG(G) expression construct electroporation, re-incubation of the embryo to HH16 (E,F) or HH14 (G), and Sox10 whole-mount in situ hybridization. Arrows and lines in (E,F) reveal a dorsal–ventral reduction of the migratory neural crest cell domain on the electroporated side of the embryo (left) compared to the contralateral side of the same section (right), with no change in domain size observed in the control (G). e, eye; TG, trigeminal ganglion. Scale bars in all images are 100 μm, with scale bar in (A) applicable to (B–D) and scale bar in (E) applicable to (G).

