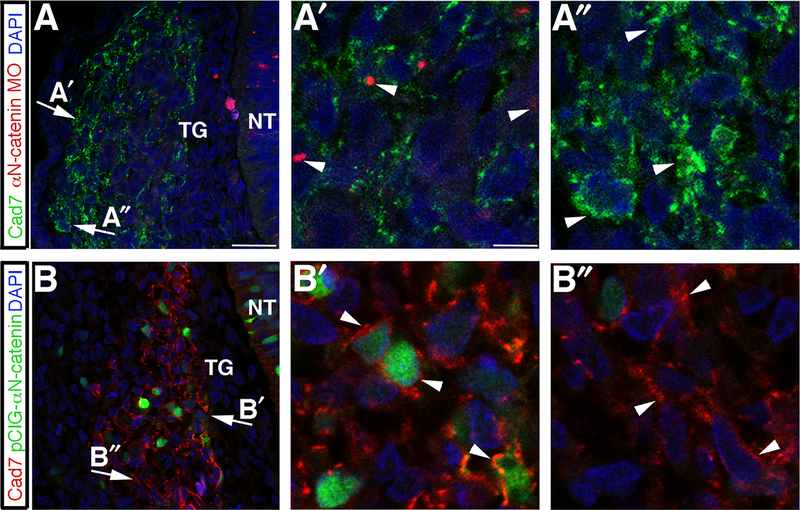
Fig. 8.
αN-catenin perturbation affects Cadherin-7 distribution and levels in the migratory neural crest cell population contributing to the trigeminal ganglia. (A,B) Representative transverse sections taken at the axial level of the developing trigeminal ganglia after αN-catenin MO (A) or pCIG-αN-catenin (B) electroporation and re-incubation of embryos to HH16, followed by Cadherin-7 (and GFP in (B)) immunohistochemistry. Arrows indicate regions of higher magnification within the ganglion, as shown by (A′) for αN-catenin MO-positive cells, (A″) for αN-catenin MO-negative cells, (B′) for pCIG-αN-catenin-positive cells, and (B″) for pCIG-αN-catenin-negative cells. Arrowheads in (A′) reveal diminished Cadherin-7 compared to Cadherin-7 in αN-catenin MO-negative cells (A″, arrowheads), or enhanced (B′) Cadherin-7 at the plasma membrane in pCIG-αN-catenin-positive cells (B′) compared to Cadherin-7 in pCIG-αN-catenin-negative cells (B″). DAPI (blue) labels cell nuclei in all images. NT, neural tube; TG, trigeminal ganglion. Scale bar in (A) is 13 μm and applicable to (B), while scale bar in (A′) is 3.3 μm and applicable to (A″,B′,B″).

