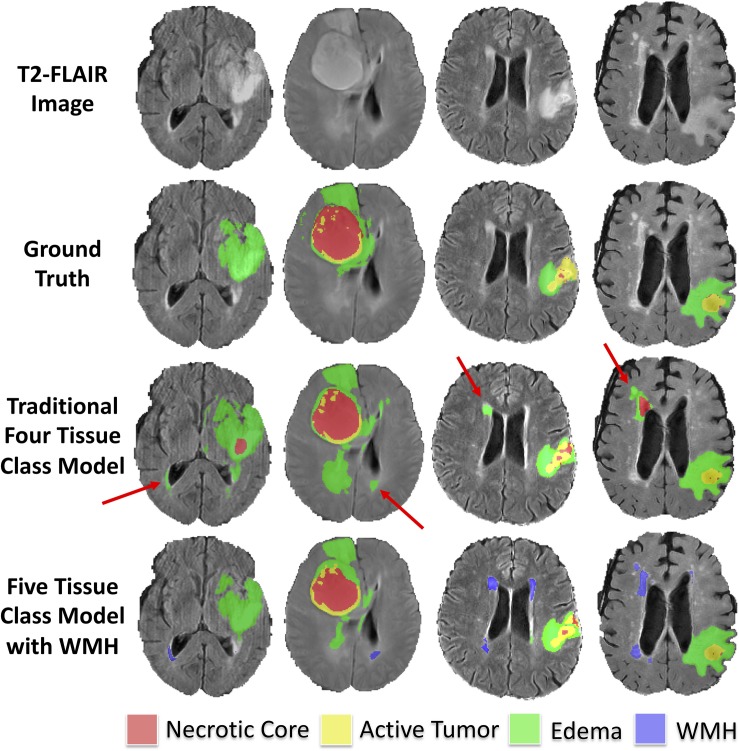
FIGURE 3.
Example segmentations in training subjects with smaller (better) Hausdorff distance metrics in the model with WMH. Axial T2-FLAIR slices of four example training cases are shown in the first row. The ground truth segmentations are overlaid in the second row (background, AT, NCR, and ED). The predicted tumor segmentations overlaid from the four-class model (background, AT, NCR, and ED) and the five-class model (background, AT, NCR, ED, and WMH) are shown in the third and fourth rows, respectively. The red arrows indicate multiple WMH distal to the tumor that were incorrectly classified in the four-class model as either ED or NCR.

