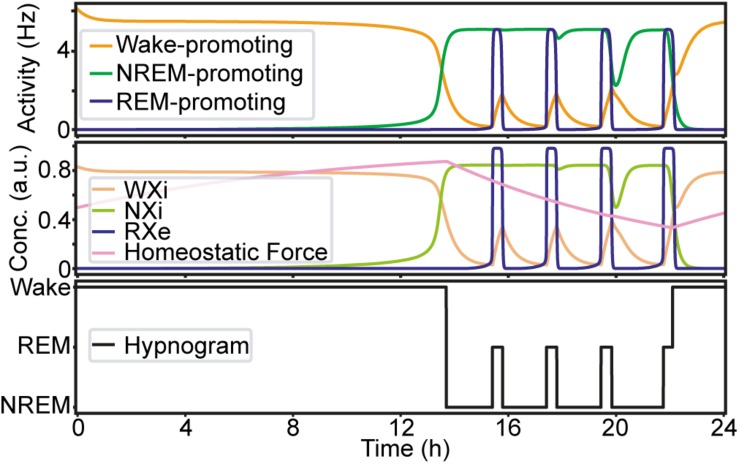
FIGURE 2.
An example of the sleep–wake cycle generated by the network with the initial parameters. Top, the firing rate of each population as a function of time. Middle, the concentration of the neurotransmitters and the homeostatic force. Bottom, a hypnogram which was determined based on firing rates of the three neural populations.

