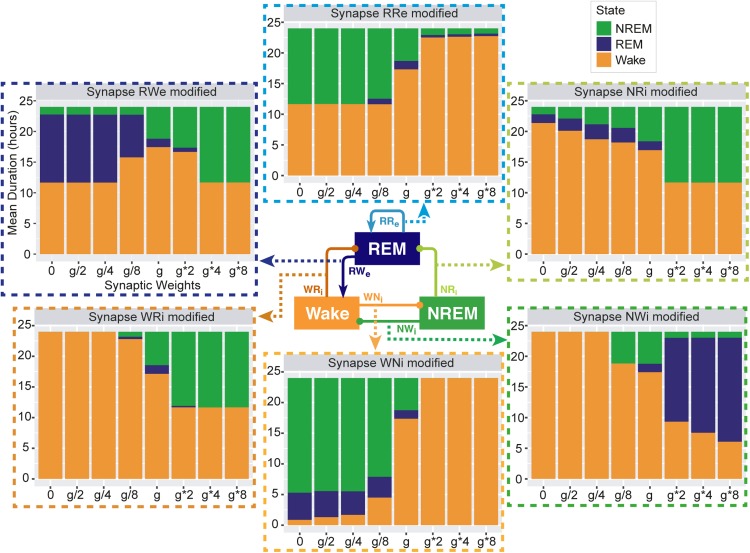
FIGURE 3.
Total duration of each sleep state for different synaptic weights. Each bar graph represents the total duration of each state as a function of synaptic weights. The variable g represents the synaptic weight for the control condition. Each value is an average duration of each state from 8 simulations.

