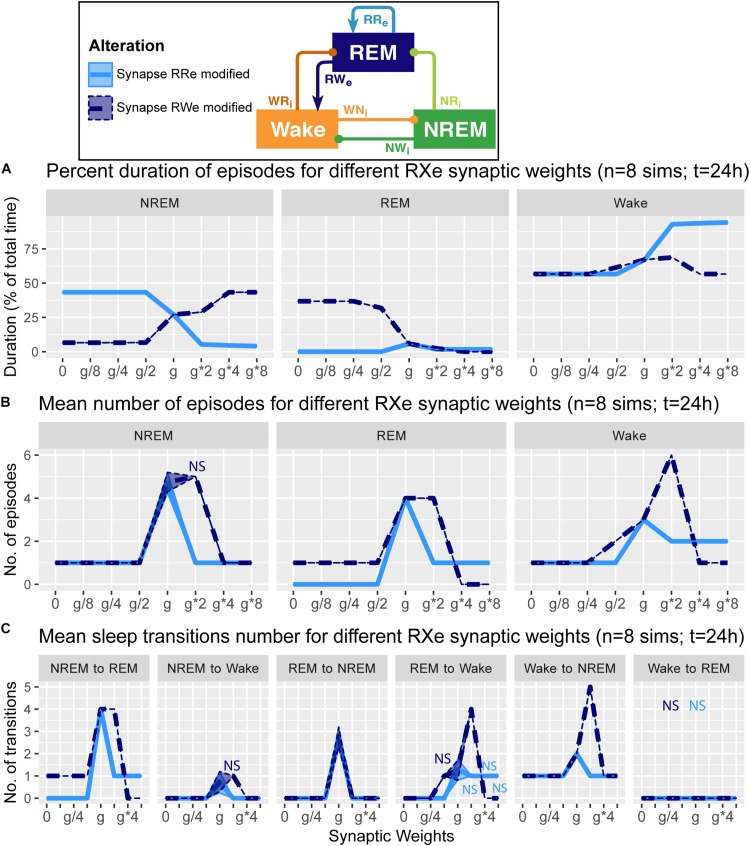
FIGURE 4.
Effects of synaptic weight alterations of the REM population on sleep architecture. The percentage of time spent in each state (A), the number of episodes (B), and the number of state transitions (C) as a function of synaptic weights. Each profile was based on eight 24 h simulations. Data presents mean ± s.e.m. Light blue, RRe pathway; dark blue, RWe pathway. NS, non-significant (one-way ANOVA).

