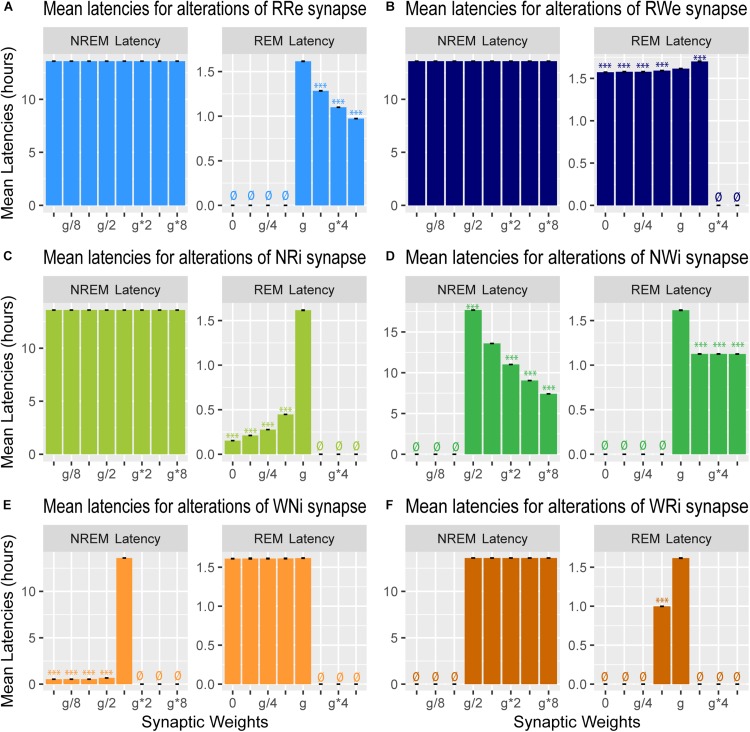
FIGURE 7.
Effects of synaptic weight alterations on sleep latency. Bar graphs represent mean latency for NREM (left) and REM (right) as a function of synaptic weights in modifications of RRe (A), RWe (B), NRi (C), NWi (D), WNi (E), and WRi pathways (F). Error bars, s.e.m.; ø, no occurrence of the state.

