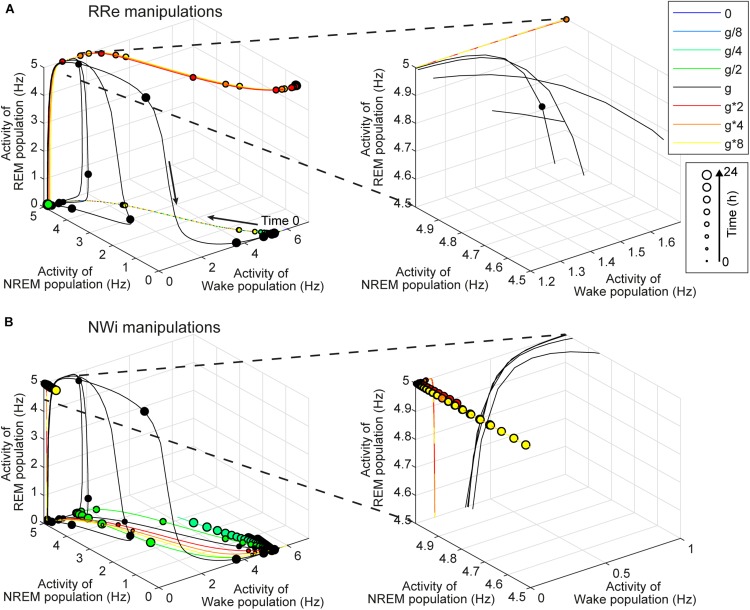
FIGURE 8.
Effects of synaptic modifications on the dynamics of population activity. (A) Modifications of RRe pathway. (B) Modifications of NWi pathway. In each plot, the firing rate dynamics of three populations are shown in three-dimensional space. Line colors indicate types of synaptic modifications. Every 30-min time point is marked and their sizes represent time points of the simulation. Right panels show the magnified traces.

