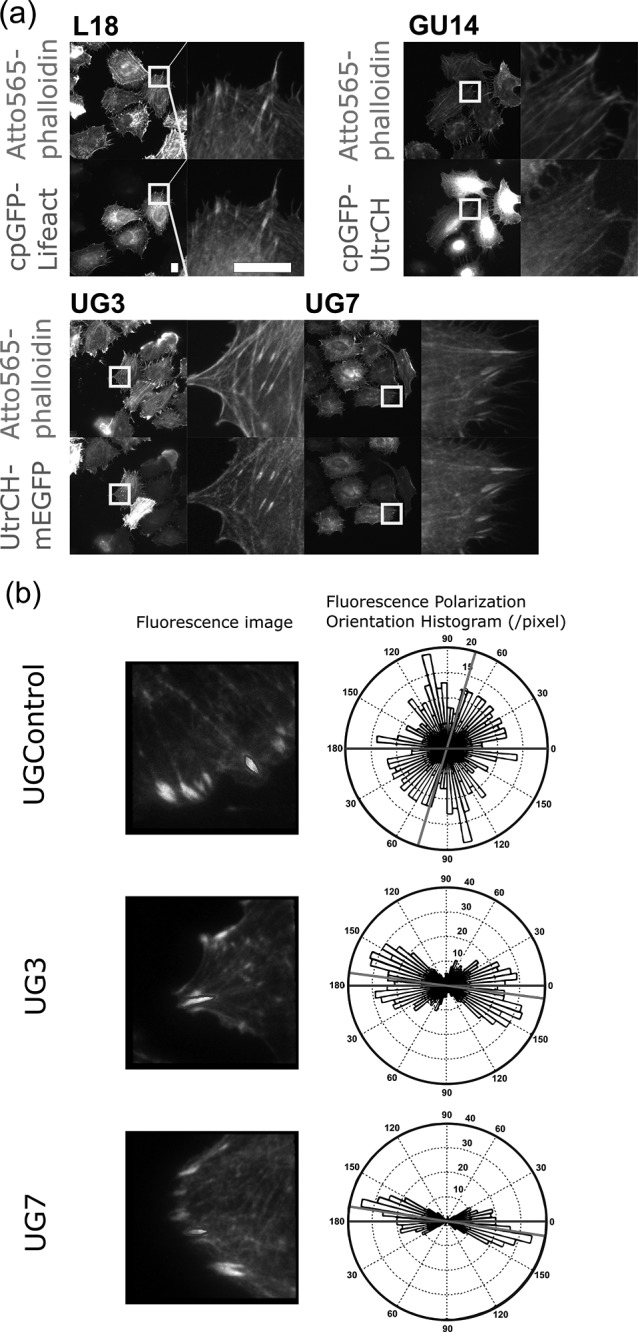
Fig. 5.

Comparison of the performance of the fusion constructs as F-actin orientation probes. (a) Binding of the constructs to F-actin in the absence of SiR-actin. HeLa cells expressing each construct were fixed with 3% PFA, stained with Atto565-phalloidin and imaged with an epi-fluorescence microscope. (Scale bar: 10 μm) (b) Ensemble fluorescence polarization orientation analysis of genetically encoded F-actin orientation probes. LLC-PK1 cells expressing UGControl, UG3 and UG7 were imaged with the instantaneous FluoPolScope. Focal adhesions (FAs) were selected as the locations for measuring the fluorescence polarization orientations of the constructs. The margins of FAs were traced (ROIs shown by black lines) to select the regions for analysis. For each construct, representative images of FAs in LLC-PK1 cells and a rose plot histogram of ensemble fluorescence polarization orientation measured at the selected FA (enclosed by black lines) are shown. The horizontal black line represents the long axis of the ROI and the gray line represents the mean orientation of ensemble fluorescence polarization in the ROI.
