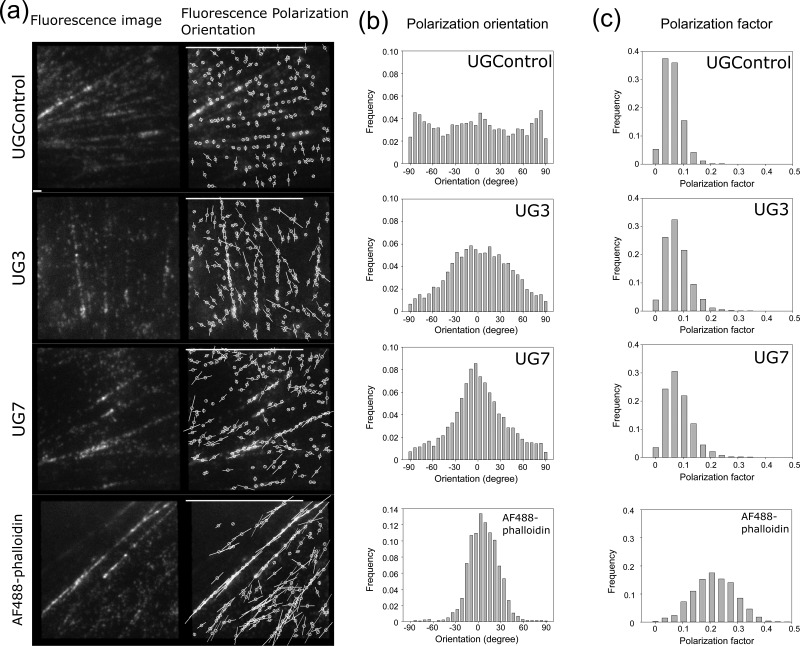
Fig. 6.
Single particle analysis of fluorescence polarization in F-actin orientation probes. (a) Single particle analysis of the fluorescence polarization orientation and the polarization factor. LLC-PK1 cells expressing UGControl, UG3 and UG7 and LLC-PK1 cells loaded with AF488-phalloidin were imaged with the instantaneous FluoPolScope. Fluorescence images of stress fibers in LLC-PK1 cells (left) and the orientation maps of the polarized fluorescence of F-actin orientation probes bound to stress fibers (right) are shown. The orientation of white bars represents the fluorescence polarization orientation, and the length of the bar represents the polarization factor. Bars on the bottom: 1 μm; bars on top, polarization factor = 1. (b) Histograms of the fluorescence polarization orientations of F-actin orientation probes tested. Fluorescent particles in a series of ~100 frames (total number of particles, >2000) were analyzed for each construct and AF488-phalloidin. Central axes of actin bundles were manually determined on MATLAB. (c) Histograms of the polarization factors of the F-actin orientation probes tested. Datasets are the same as we used for the fluorescence polarization orientation analysis in (b). In (b) and (c), representative histograms are shown.

