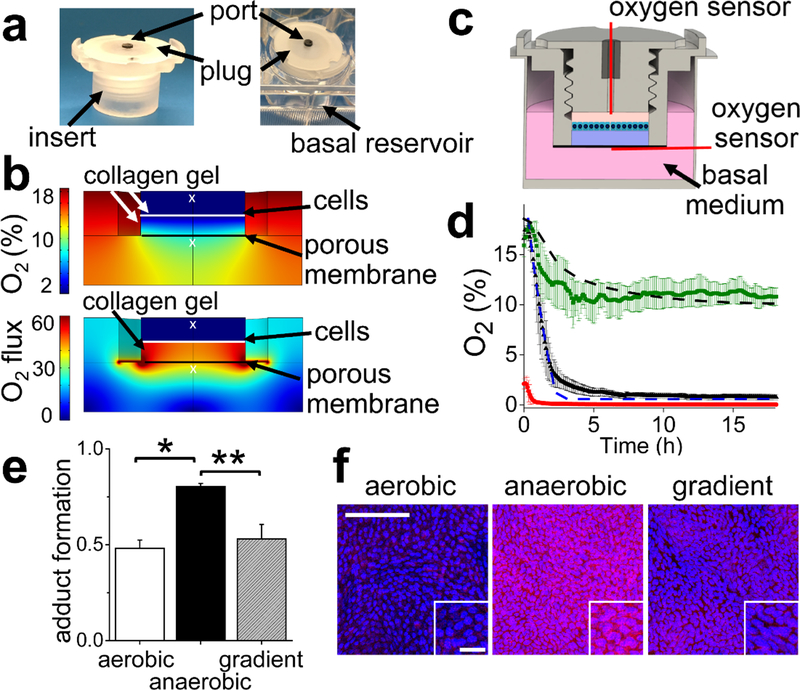
Figure 1.
Design and testing of the oxygen gradient device. a) An image of the device insert (left panel) and the assembled device (insert plus basal compartment, right panel). The insert possessed a gas-impermeable threaded plug to isolate the luminal compartment from the external atmosphere. A port in the plug was used for addition of reagents and measurement of the oxygen saturation. A single well of a 12-well plate was used as the basal reservoir. b) The simulated oxygen saturation (top panel) and oxygen flux (lower panel) in the device at 24 h after the plug was placed. The white “×”s indicate the location of the oxygen probe in the experimental measurements. The Y axis units for O2 flux is (mol/m2∙s). c) Schematic of a coronal section through the device. The red lines indicate the locations of the oxygen probes during the experimental measurements. d) The measured and simulated luminal and basal oxygen profiles over time. The dashed black line and green squares represent the simulated and average measured, basal oxygen saturation, respectively, when the basal and luminal compartments are initially filled with normoxic medium. The dashed blue line and black triangles represent the simulated and average measured, luminal oxygen saturation, respectively, when the luminal and basal compartments are initially filled with normoxic medium. The red circles represent the average oxygen saturation in the luminal compartment when it is initially filled with deoxygenated medium. 3 independent samples were used for all measured values and the error bars depict a single standard deviation of the data points. e) The formation of pimonidazole adducts plotted against the oxygen culture condition. The Y axis displays the normalized adduct formation calculated as the intensity of immunofluorescence staining of the adducts divided by the fluorescence intensity of the Hoechst 33342 dye (N=3 independent samples for all conditions). * and ** indicate p<0.001 or 0.005, respectively. f) Representative images of pimonidazole adduct formation (red) as detected by immunofluorescence staining in aerobic, anaerobic and the oxygen-gradient environments. Hoechst 33342 fluorescence is shown in blue. Scale bar in the large image is 100 μm and in the inset 20 μm.

