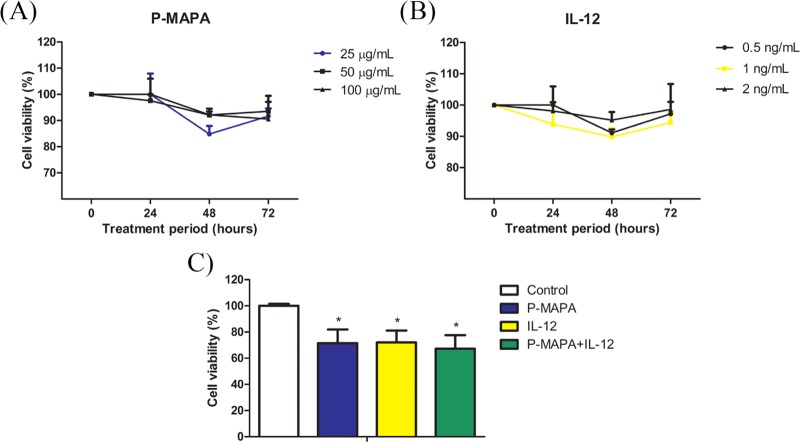
Figure 1.
Defining the treatments with P-MAPA and IL-12. (A) Cell viability (%) after exposure to three different doses of P-MAPA (25, 50, and 100 μg/mL) in four different periods (0, 24, 48, and 72 h). (B) Cell viability (%) after exposure to three different doses of IL-12 (0.5, 1, and 2 ng/mL) in four different periods (0, 24, 48, and 72 h). Colored line of the selected dose is highlighted. (C) Cell viability (%) was assessed by MTT (1 × 10³ cells) after exposure to standardized doses of treatments (25 μg/mL P-MAPA, 1 ng/mL IL-12, or both) at 48 h. The results are expressed as the mean ± standard deviation (SD). *p < 0.05 vs control.

